A deep analysis pass on an event contract is expensive. Somebody reads the resolution criteria, checks how the venue has handled ambiguity before, pulls the book, forms a view on the underlying question and writes it down. Call it an hour of a competent person's time at the low end. Against a screen showing a thousand rows, and a platform whose analysis coverage panel reports 1,550 analyses across a universe of over a hundred thousand listings, the scarce resource is obvious and it is not data.
So the interesting question is not how to analyse a market. It is how to choose the ten out of a thousand that get analysed this week, using only what is on the screen before the expensive work starts, and how to demonstrate afterwards that the choice rule was better than picking rows off the top of the default sort.
Triage runs on the columns that are populated before analysis
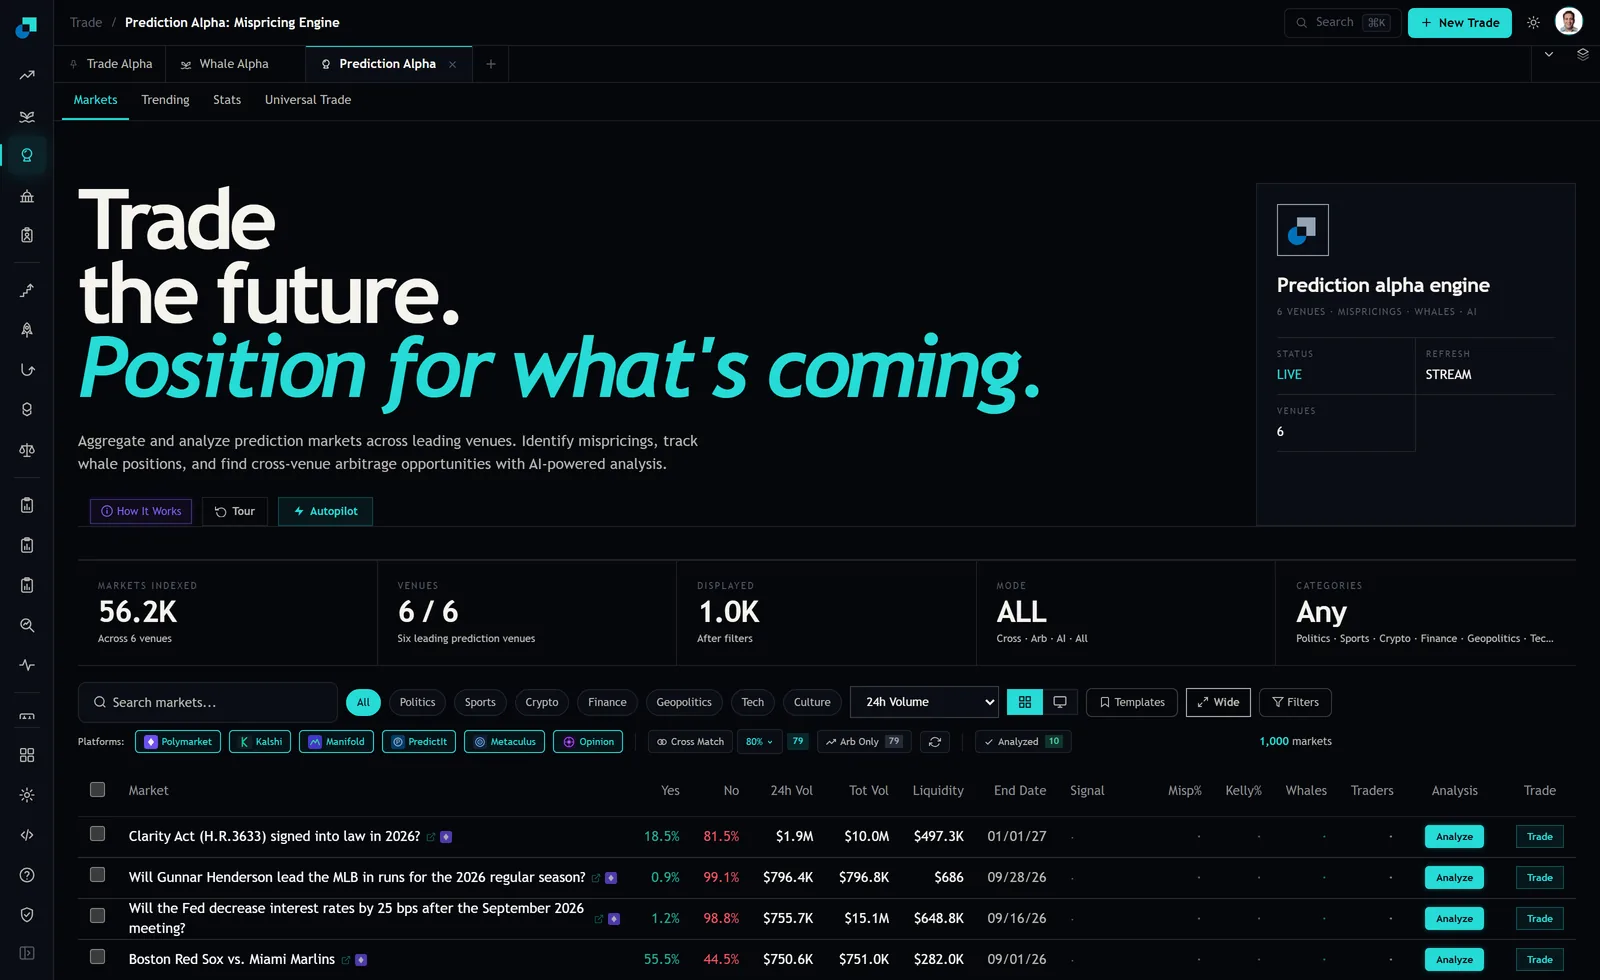
This constraint is the one that shapes everything else and it is visible in the capture. The markets tab shows fourteen columns. On every row I could see, the Signal, Misp%, Kelly%, Whales and Traders cells rendered as a single placeholder dot. The Analysis column holds an Analyze button, and a chip above the table reads Analyzed 10 against 1,000 displayed markets.
That is coherent behaviour rather than a fault. The module's own description says analysis is generated on demand. But it has a hard consequence for process design: mispricing rank cannot be an input to triage, because Misp% is an output of the thing you are triaging for. Any workflow that says sort by mispricing and analyse the top ten is describing a screen that does not exist until after the budget has already been spent.
What you are left with is the pre-analysis set: the market text, the Yes and No prices, 24h volume, total volume, liquidity, end date, the venue badge, and the cross match and arb controls above the table. That is enough, and building the rule from those columns has the incidental benefit that every input is cheap, reproducible and auditable.
Three gates before any scoring
Gates are binary and they come first, because a score that ranks ineligible contracts wastes the budget more efficiently than no rule at all.
The tenor gate. Reject any contract whose end date is inside your minimum research horizon. If a deep pass takes a day and the contract resolves tomorrow, the analysis cannot inform a decision. This gate alone removes most of the volume leaderboard, where nine of the ten top rows in my capture were fixtures resolving within about a day.
The depth gate. Reject any contract whose observable resting book cannot support your minimum position at your stated participation rate. Four adjacent rows in the capture showed liquidity of $497.3K, $686, $648.8K and $282.0K. The second of those is not a small opportunity, it is not an opportunity, and no amount of analytical quality changes that.
The venue gate. Reject contracts on venues you are not onboarded to, and on venues whose participants do not make the price a price. The module's coverage list describes one venue as play-money community markets and another as a forecasting community with calibrated probabilities. Whatever those are worth as information, they are not places a book takes risk, and analysing their contracts consumes budget that produces nothing actionable.
Run those three and a thousand rows typically becomes a few dozen. The scoring rule only ever operates on the survivors, which is also why the score can afford to be simple.
Score on depth to turnover, cross match presence and price region
Three components, each computable from a populated cell, each pointing at a different kind of opportunity.
The first is the ratio of liquidity to 24 hour volume, which measures how much book is standing behind the flow. Across the four captured rows it reads 0.26 for the Clarity Act contract, 0.86 for the Fed rate contract, 0.38 for the baseball fixture and roughly 0.0009 for the row with the $686 book. Three orders of magnitude across four adjacent rows. A high ratio says the market is deep relative to how much it is being traded, which is where a well researched view can be expressed without the research being priced in by your own footprint. A very low ratio says flow is passing through a book that is not there, which is a data question rather than a research opportunity.
The second is the ratio of 24 hour volume to total volume, which flags repricing. The Fed contract shows $755.7K against $15.1M, about five percent, a long lived market ticking along. The Clarity Act shows $1.9M against $10.0M, nineteen percent, which is a market having a week. A contract that has just done a fifth of its lifetime business in a day is either responding to news or being repriced by someone with a view, and both are reasons to look.
The third is cross match presence, which the platform gives you directly. The control above the table reads Cross Match at an 80 percent threshold with a count of 79, against a thousand displayed rows. Fewer than one row in twelve has a counterpart at that threshold, which makes it a genuinely selective binary flag. A contract listed on two venues gives you a second price to reason against and a second set of resolution criteria to compare, and the comparison itself often produces the finding.
Add a fourth component as a penalty rather than a score: contracts priced in the extreme tails. Two of the four captured rows sat under one and a half cents on the Yes side. In that region a one tick move is a large relative change, costs are enormous as a share of the price, and the analytical question collapses into whether an unlikely thing happens, which is exactly where analysis is least able to add value.
You cannot backtest triage against mispricing rank, so test it against decisions
The obvious validation is to check whether your rule selects the contracts that later show the largest mispricing. On this platform that test is not available, because mispricing is only computed for contracts that were analysed, so the comparison set does not exist. Selecting on the outcome variable is not a subtle problem here, it is the entire design.
Run a holdout instead, and define the outcome as a decision rather than a price. Each week, take your ten by the rule and add three chosen at random from the post-gate survivors. Analyse all thirteen without the analyst knowing which is which. Then score each analysis on one binary: did it change what the desk did. A pass that confirms an existing view and leads to no action scores zero, however well written it was.
After a quarter you have around forty rule-selected and twelve random analyses and a hit rate for each. If the rule is not clearly ahead of random, it is decoration and you should say so in the research review rather than keep it because it took effort to build. If it is ahead, you also know by how much, which is what tells you whether to spend more budget or less.
What the record has to hold for the review
The reason to write this down as a rule rather than run it on judgement is that the rule is what gets examined when a position goes wrong. Two questions come up every time. Why did we look at this contract, and why did we not look at the one that would have told us something.
So the queue needs to be logged, not just the analyses. For every week, store the filter state that produced the thousand rows, the count that survived each of the three gates, the score components for every survivor including the ones you did not pick, and the ten selected. That last part is the one people skip and it is the one that matters, because the near misses are the evidence about whether the threshold is set in the right place.
It also protects against the failure mode this whole process exists to prevent, which is the desk quietly reverting to analysing whatever sits at the top of the default sort. That sort is 24h Volume, the top of it is same day sports, and a research programme that drifts there will produce a great deal of work on contracts that were never eligible in the first place.