The word sentiment gets used for two completely different measurements and the confusion costs people money. One is a survey asking households how they feel about their own financial situation and whether this is a good time to buy something expensive. The other is a gauge of how investors are positioned in markets right now. They are both called sentiment, they both produce a number, and they answer questions that have almost nothing to do with each other.
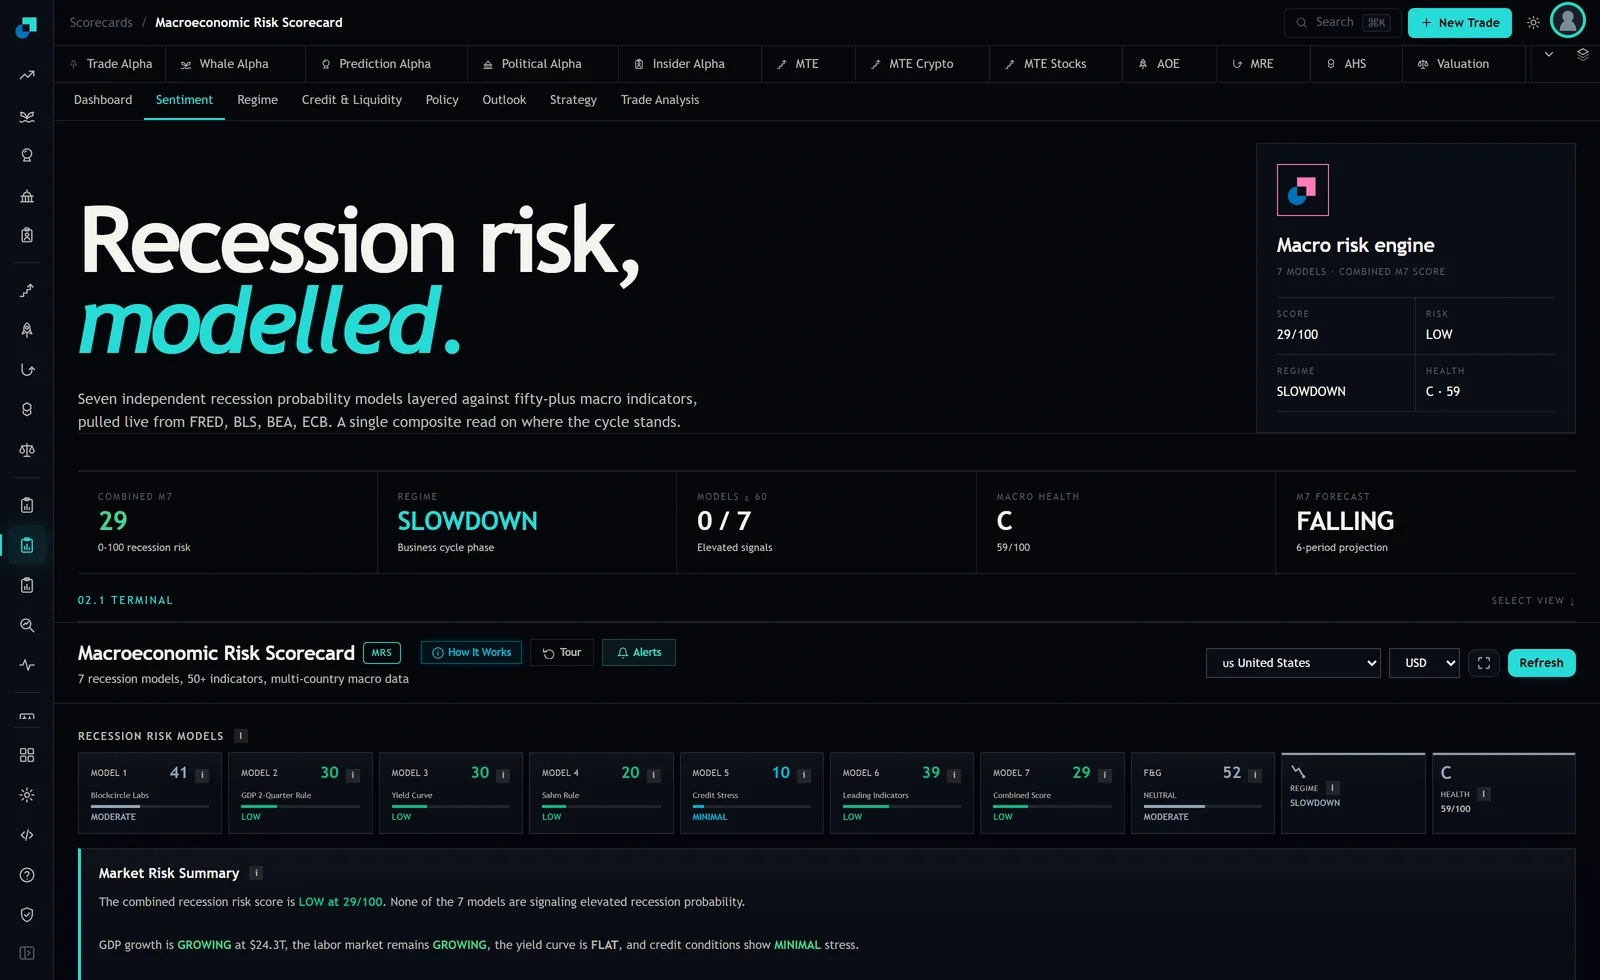
On the Macro Risk Scorecard the visible sentiment reading is the fear and greed tile, which sits at the right end of the model row and currently shows 52, labelled NEUTRAL. That is the second kind. It is a market-positioning read, and treating it as a proxy for how the household sector is doing is a category error.
Two questions, two different populations
Start with who is being measured, because that is where the divergence comes from.
A household confidence survey samples the general population. Most of the people in that sample own little or no financial market exposure beyond a retirement account they do not look at. Their answers are driven by the things that dominate a household budget: whether they have a job, whether prices at the shop have moved, what the rate on a car loan or a mortgage looks like, whether their employer has been making noises about cuts.
An investor sentiment gauge measures something else entirely. It is assembled from market behaviour, things like volatility, breadth, momentum, and how options and other instruments are being used. Its population is people with money at risk in markets, and their state of mind is a function of what prices have recently done.
So one is downstream of the labour market and the price level, and the other is downstream of recent returns. There is no mechanism forcing them to agree, and long periods where they do not are the normal case rather than an anomaly.
Why the divergence runs for months rather than days
The gap persists because the two series respond at different speeds to different things.
Market positioning turns quickly. A sharp drawdown moves an investor sentiment gauge within days, and a recovery moves it back just as fast, because the inputs are prices and prices are continuous. Household confidence is a monthly survey of a slow-moving reality. A person who has kept their job and whose grocery bill has not changed does not answer differently because an index fell eight per cent last week.
Then there is asset ownership, which is heavily concentrated. A large move in financial markets is an enormous event for the minority of households holding most of the assets and a nearly invisible one for the majority. The survey averages over everybody, so it barely registers what the gauge is screaming about.
Running the other way, a genuine deterioration in the labour market shows up in the survey first and in market positioning later, because the household feels it directly while the market has to infer it from published statistics that arrive with a delay.
Which one belongs in a read on the cycle
Household confidence, and it is not close.
The reason is causal. Consumer spending is the largest single component of economic output in most developed economies, and a household that expects to lose its job postpones the car, the holiday and the new roof. Those postponements are the actual mechanism by which a slowdown propagates. The survey question about whether now is a good time to make a major purchase is, quite literally, asking people whether they are about to do the thing that constitutes the aggregate.
Investor sentiment has no such link. It tells you how markets are positioned, which is useful for a different purpose entirely. A market can fall hard while households keep spending, and households can be gloomy while markets grind higher. Both configurations happen, and both look like a contradiction only if you have collapsed the two measurements into one word.
The Macro Risk Scorecard keeps them separate in structure, which is the right design. Its cycle read sits in the model row and the header, currently showing a combined M7 score of 29 out of 100 tagged LOW, a regime label of SLOWDOWN, a macro health grade of C at 59, and 0 out of 7 models at or above the 60 threshold. The positioning read is the fear and greed tile at 52. These are separate numbers because they are separate ideas.
Reading the two together without mixing them
The useful practice is to look at both and to name which question each is answering before you draw any conclusion.
- Write the two readings in the same note each month, with a label on each: cycle input, positioning input. Labelling them forces the distinction and takes four seconds.
- When they agree, do not treat the agreement as confirmation. Two measures pointing the same way is only evidence if they are independent, and in a period where a market fall has been driven by something households also experienced, such as a jump in living costs, they are not independent at all.
- When they diverge, work out which population is seeing something the other cannot. Households gloomy while markets are calm usually means a labour market or cost-of-living story that has not yet shown up in earnings. Markets fearful while households are steady usually means a repricing driven by rates or by a specific sector.
- Never use a positioning gauge to decide how much of your income you can afford to put at risk. That decision belongs to your own job security and your own cash buffer, which is the household question, answered by you rather than by a survey.
The mistake this prevents in an actual account
The concrete error I have watched people make repeatedly is reading a fearful investor sentiment gauge, concluding that the economy is in trouble, and cutting a long-term allocation on that basis.
The gauge was not telling them anything about the economy. It was telling them that people who own assets had recently lost money and were positioned defensively, which is a description of the recent past. Selling into it converted a paper drawdown into a realised one, generated a tax event, and left them holding cash while the thing that would tell them about the cycle, the household and labour data, had not moved.
The inverse error is quieter and just as expensive. Household confidence weakens, the investor gauge stays comfortable, and people conclude that the market has looked at the survey and dismissed it. Markets do not read surveys and reach considered verdicts. Positioning simply has not adjusted yet, and it may or may not need to.
Keeping them in separate columns is unglamorous but it does the work. One column is about whether your neighbours are going to buy a car. The other is about whether the people you are trading against are already leaning the way you want to lean. You need both, and you will make worse decisions with either one if you let it answer the other one's question.