When people look for a reason behind an energy disclosure, they look at the price chart. The stock moved, the filing was near the move, therefore the filing anticipated the move. That reasoning is available for every trade in the dataset and it explains nothing, because on any given month a good fraction of stocks have moved and a chart will always offer you a story.
Permitting is a better clock. Lease sales, pipeline approvals and the various permitting decisions that govern what an energy company is allowed to build are administrative processes. They are slow, they are scheduled, the agencies running them publish their calendars, and the outcome lands on a date that was knowable weeks in advance. If disclosed energy trades carry information, that is where you would expect to see it, and unlike a price move, a permitting date cannot be discovered retroactively to fit whatever you already found.
The claim, stated so that it can be wrong
Here is the proposition in a form that has a failure condition. Energy filings, when several members file the same energy name in a short window, should sit closer in time to scheduled permitting and leasing decisions than a randomly chosen set of energy filings does.
Notice what that formulation does. It does not say a cluster predicts a permitting outcome. It does not say the members knew anything. It says the timing distribution of clustered filings should differ from the timing distribution of unclustered ones, relative to a fixed set of dates. That is a comparison you can actually make, and it can come back negative, which is the property that makes it worth doing.
I have not run it to a conclusion and I am not going to tell you how it comes out. What follows is how to run it with what the module provides and where it will mislead you.
The date the module gives you, and the ones it does not
Open a cluster card and look at the fields. The ticker and company at the top left, an unlabelled number at the top right, a summary line reading member count, direction and USD volume, and then a line reading Window with an explicit start and end date. Under that sits the member table, with Party, Politician, Type and Amount columns.
The Window line is the date information you have. On the card I pulled it spanned ten days. There is no date filter on this tab, no way to say show me only clusters near these dates, and no segmentation control that would do the grouping for you. The two buttons at the top, All Clusters and Bipartisan Only, operate on party.
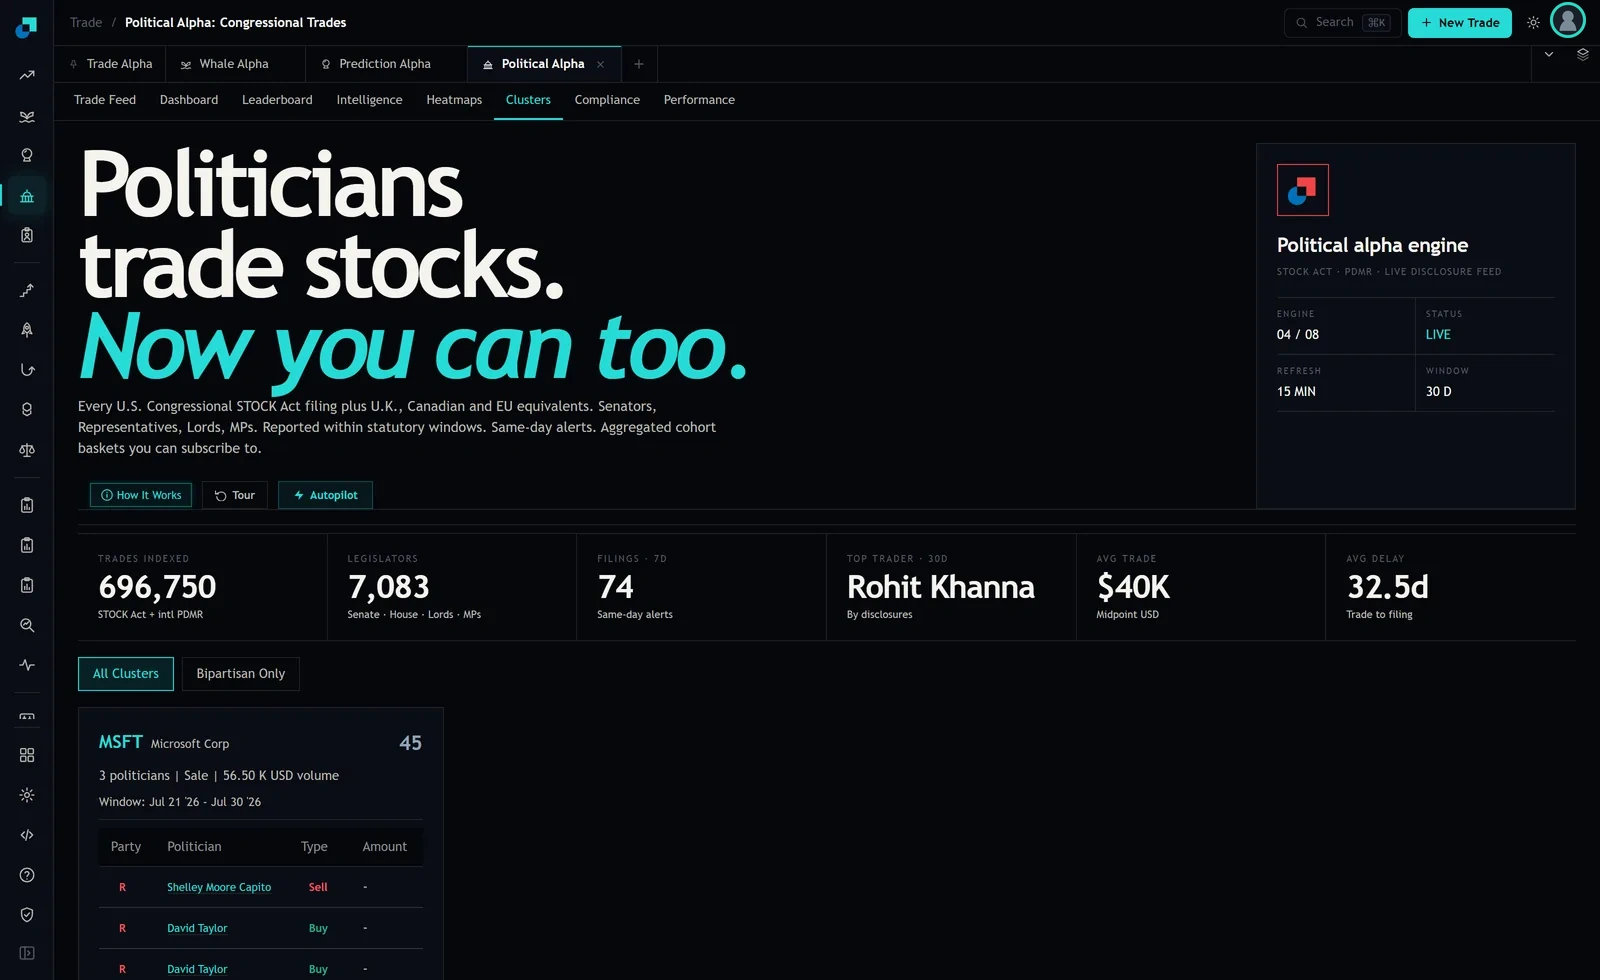
So the test is manual and it lives in a spreadsheet, not in the module. Three columns: ticker, window start, window end. One row per energy cluster, added as you see them. That is the entire data collection job and it takes a minute a week.
One more thing you should know before starting. On my capture of the sector heatmap, ten tiles were visible and Energy was not one of them. The ten showing were Information Technology, Industrials, Health Care, Financials, Consumer Discretionary, Consumer Staples, Communication Services, Materials, Real Estate and Utilities. A tile may well sit below the fold, so scroll before concluding anything, but the visible grid ran 752 transactions across those ten sectors in a month and the smallest of them carried sixteen. Energy clusters are not going to be abundant. Expect to spend months collecting rows.
Write the calendar first, and timestamp it
This is the step that decides whether you have done research or told yourself a story, and it has to happen before you look at a single filing.
Build a list of scheduled energy decisions from the agencies' own published calendars. Lease sale dates. Scheduled decisions on pipeline and terminal applications. Comment periods with published closing dates, since a closing date is itself a scheduled event that precedes a decision. Do not take dates from a news article and do not take them from memory, including mine. Take them from the body that publishes them, note where you got each one, and save the file with a date on it.
Then, and only then, start collecting cluster windows. When you have both, the comparison is arithmetic. For each cluster, compute the number of days between the window and the nearest scheduled decision for that company or its sub-industry. Do the same for a control set, energy filings that did not form clusters, over the same period. If the clustered set sits systematically closer, you have something. If the two distributions look the same, the hypothesis failed and you have saved yourself a year of pattern matching.
Three ways this test will fool you
The first is finding the date afterwards. If you see a cluster in March and then go looking for what was happening in energy policy in March, you will find something every time, because something is always happening. The timestamp on your calendar file is the only defence, and it only works if the file predates the filings you are testing.
The second is the ten day window. A cluster window spanning ten days cannot be placed precisely against a decision date, and if your permitting calendar has events every few weeks, almost any ten day window will be near one. Set your closeness threshold before you look at the data, something tight enough that a random window would rarely satisfy it, and then hold yourself to it. If your threshold has to be loosened to produce a result, the result is the threshold.
The third is that most co-occurrence is just ownership. Members hold what everyone holds, and large energy companies are in every index fund and every dividend portfolio in the country. Several members filing one large-cap energy name in a fortnight is what popularity looks like, not what information looks like. A cluster on a small or unfamiliar company is far more interesting than a cluster on a household name, and you should weight your rows accordingly rather than treating all clusters as equivalent evidence.
What a positive result would actually be worth
Suppose the distributions differ and clustered energy filings genuinely sit closer to scheduled decisions. What can you do with that?
Less than the effort suggests, and it is worth being clear about why. The module reports average delay from trade to filing at 32.5 days. The trades you are studying became visible roughly a month after they happened, which for a permitting process means the decision has usually landed and been priced before the card ever appeared. So the finding would tell you something real about how the world works and would not, by itself, give you an entry.
Where it does pay is the next cycle. If you learn that clustered energy filings bunch ahead of scheduled decisions, then the calendar becomes the primary tool and the filings become the confirmation. You watch the scheduled dates directly, you form a view on the company through ordinary research, and the disclosure feed becomes a small piece of after-the-fact evidence about whether people close to the process were positioned the same way. That is a modest role and it is an honest one, and it is a much better outcome than the alternative, which is running an energy position on the strength of a card whose only date field spans ten days.