Every public leaderboard has the same design property, and it is not a conspiracy, it is just what a live list is. It shows the things that currently exist. When a strategy stops working and its owner turns it off, it does not move to a page called "strategies that stopped working". It disappears, and the board silently gets better looking without a single number changing.
That is worth taking seriously before you copy anything from a ranking, because the check that costs you the most money is the one you never think to run. You are looking at the top of a list. The question is how long the list is, and how long it used to be.
The most honest version of the board is an empty one
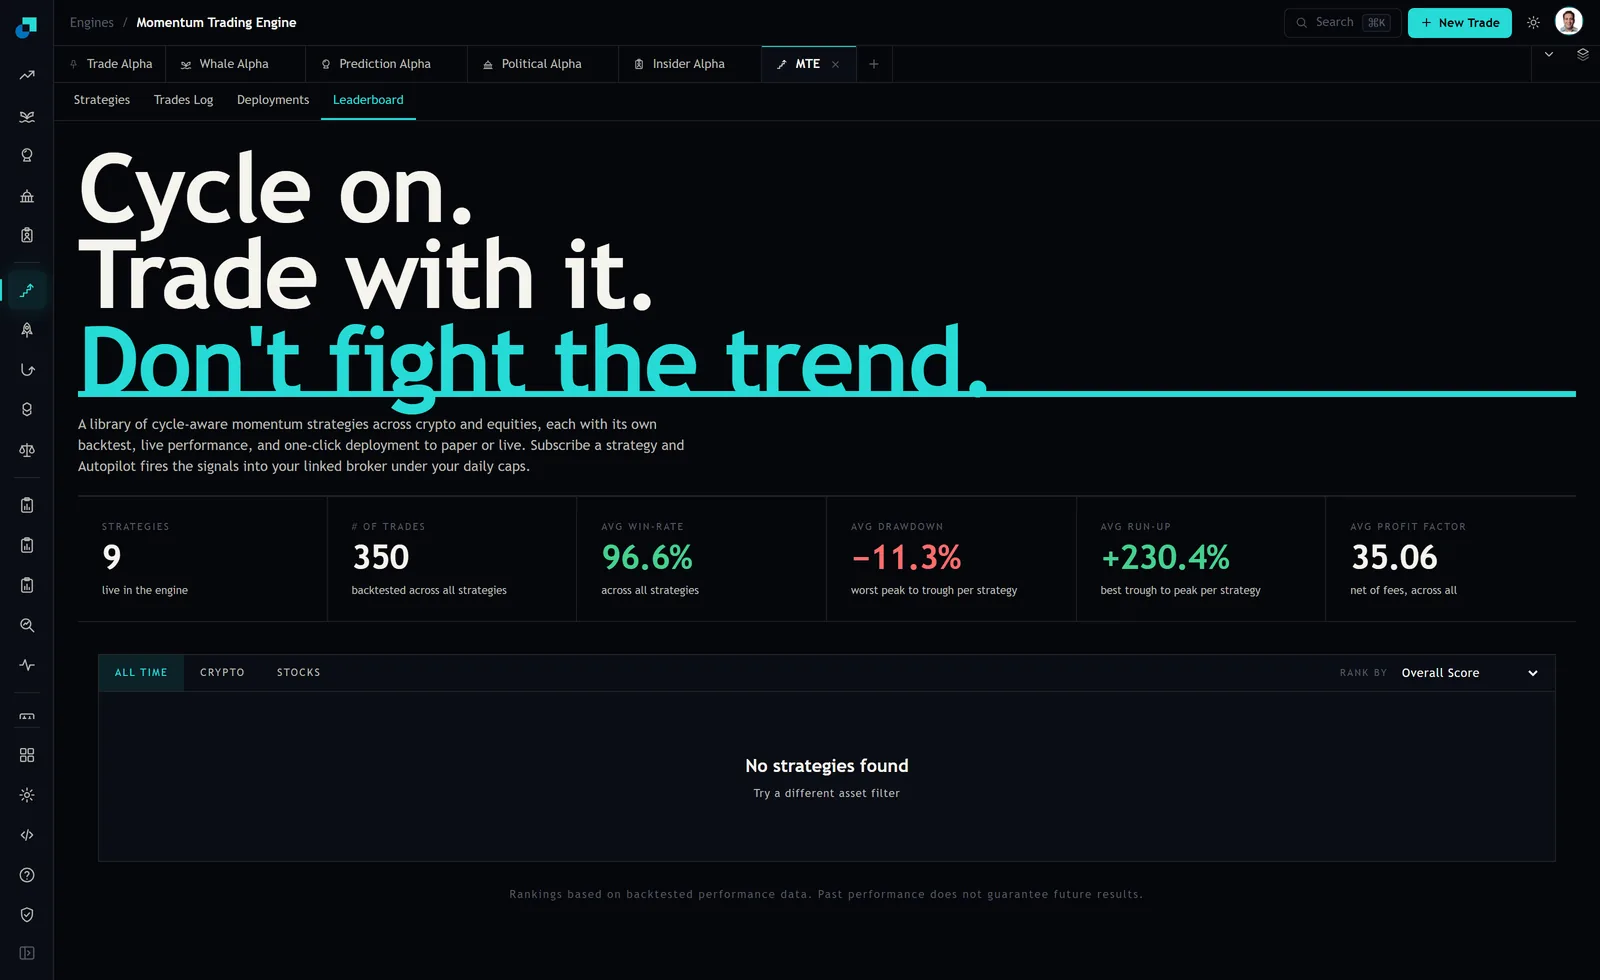
When I captured the Momentum Trading Engine's leaderboard tab, it was showing nothing. Three scope tabs across the top, ALL TIME, CRYPTO and STOCKS. A RANK BY control on the right set to Overall Score, with the other five orderings being Total Return, Risk-Adjusted Return, Win Rate, Alpha and Profit Factor. In the middle, the words "No strategies found" and a suggestion to try a different asset filter.
An empty board is the clearest possible demonstration of the point. The contents of that panel are entirely a function of who is currently running something. It is not a historical archive with a filter applied. There is no year in which it holds a fixed set of names. It holds whatever is live.
Three ways a name leaves without leaving a trace
It helps to be specific about the mechanisms, because they are not equally bad and the checks that catch them are different.
The first is the plain switch-off. Someone deployed a strategy, it lost money for two months, they stopped it. The rows it produced may still exist somewhere in a trade log, but it is off the ranking.
The second is the parameter edit. The strategy stays live, keeps its name and its slot, but its lookback or its stop got changed after a bad run. What you are now looking at is a new strategy wearing an old track record. Nothing was deleted, so nothing looks missing, and this is the version that is hardest to detect from outside.
The third is the quiet retirement of a whole generation. If the library moved from one version of an engine to the next, the previous version's configurations are not on the board. They are not anywhere. The board shows the current generation and the current generation is, by definition, the one that has not yet had time to fail.
Check one: count configurations, not strategies
The engine reports 9 strategies live. That is the numerator. The denominator is how many configurations were built and tested to arrive at nine, and it is not printed on any page. But there is a strong hint sitting in the signal feeds.
The signal cards in the crypto and stock feeds are titled by generation and number. At capture the crypto feed carried entries labelled MTE V2 CONFIGURATION 19 and CONFIGURATION 20; the stock feed carried CONFIGURATION 12 and CONFIGURATION 13. Two facts fall out of that. The label says V2, which implies a V1 that is no longer the current thing. And configuration numbers running into the twenties, against nine strategies live in the engine, implies a couple of dozen configurations were built and most did not end up in the live nine.
That is not a criticism. Building twenty configurations and keeping nine is what research looks like. It just means that when you read a ranked list of the nine, you are reading the survivors of a selection process, and the top of that list is the survivor of a survivor. Adjust your expectations of the headline numbers downward accordingly, particularly the flattering ones. The 96.6% average win rate and the 35.06 average profit factor are aggregates across the nine strategies that made it, computed over 350 backtested trades in total, which is roughly thirty-nine trades per strategy. They exclude your slippage, your delay between signal and order, and your taxes.
Check two: read the trades log for the ones that are being overridden
The trades log tab is more informative about survivorship than the leaderboard is, because it keeps rows rather than rankings. Two things there are worth your five minutes.
The first is the counter at the top right, which at capture read 357 trades and, next to it, "6 strategies holding nothing". Six of nine holding nothing is not a failure state, it is a trend system waiting for a trend. But it tells you the live signal rate is much lower than a nine-strategy library implies, so any conclusion you draw from recent activity rests on a smaller sample than you think.
The second is the amber banner above the table. It said that 44 rows below were reconstructed by replaying the strategy over historical candles, that no order was placed and no fill occurred for those, and that they show what the strategy would have done rather than what it did. Forty-four out of 357 rows are simulations sitting inside a log that otherwise looks like a record of trades. The platform labels them clearly, which is exactly right, and it is on you to exclude them before you count anything.
Then look for the word Manual. One row in the log, a long position in Nordex SE opened at 20.80 USD and closed at 19.30 for -7.21%, carried a Manual tag on its closed status. A human closed that one. Whatever the strategy would have done next is now unknowable, and if that override happens often, the track record you are reading is partly a record of somebody's discretion.
Check three: date the feed before you copy anything from it
The cheapest survivorship check available takes about thirty seconds and most people never run it. Look at the date on the most recent signal.
At capture the crypto signal feed's newest card was stamped 10 August 2026. The stock signal feed's newest card was stamped 26 November 2025, more than nine months earlier. Two feeds attached to the same engine, one recent and one not. That is not evidence of anything sinister, but it is a fact you would want before deciding which side of the library to follow, and it is not visible from a ranking.
So here is the decision I would actually make this week if I were choosing something off a board like this. Do not fund the top-ranked entry. Pick it, and run it in paper for a forward window long enough to contain twenty of its own trades, which for a 1day strategy holding for a few days is a couple of months. The forward window is the only stretch of history where the strategy had no opportunity to be selected for its performance. If it holds up over twenty forward trades, you have something. If it does not, you learned that for the price of two months of patience rather than the price of a position, and the strategy quietly leaves your own list the same way it would have left the board.