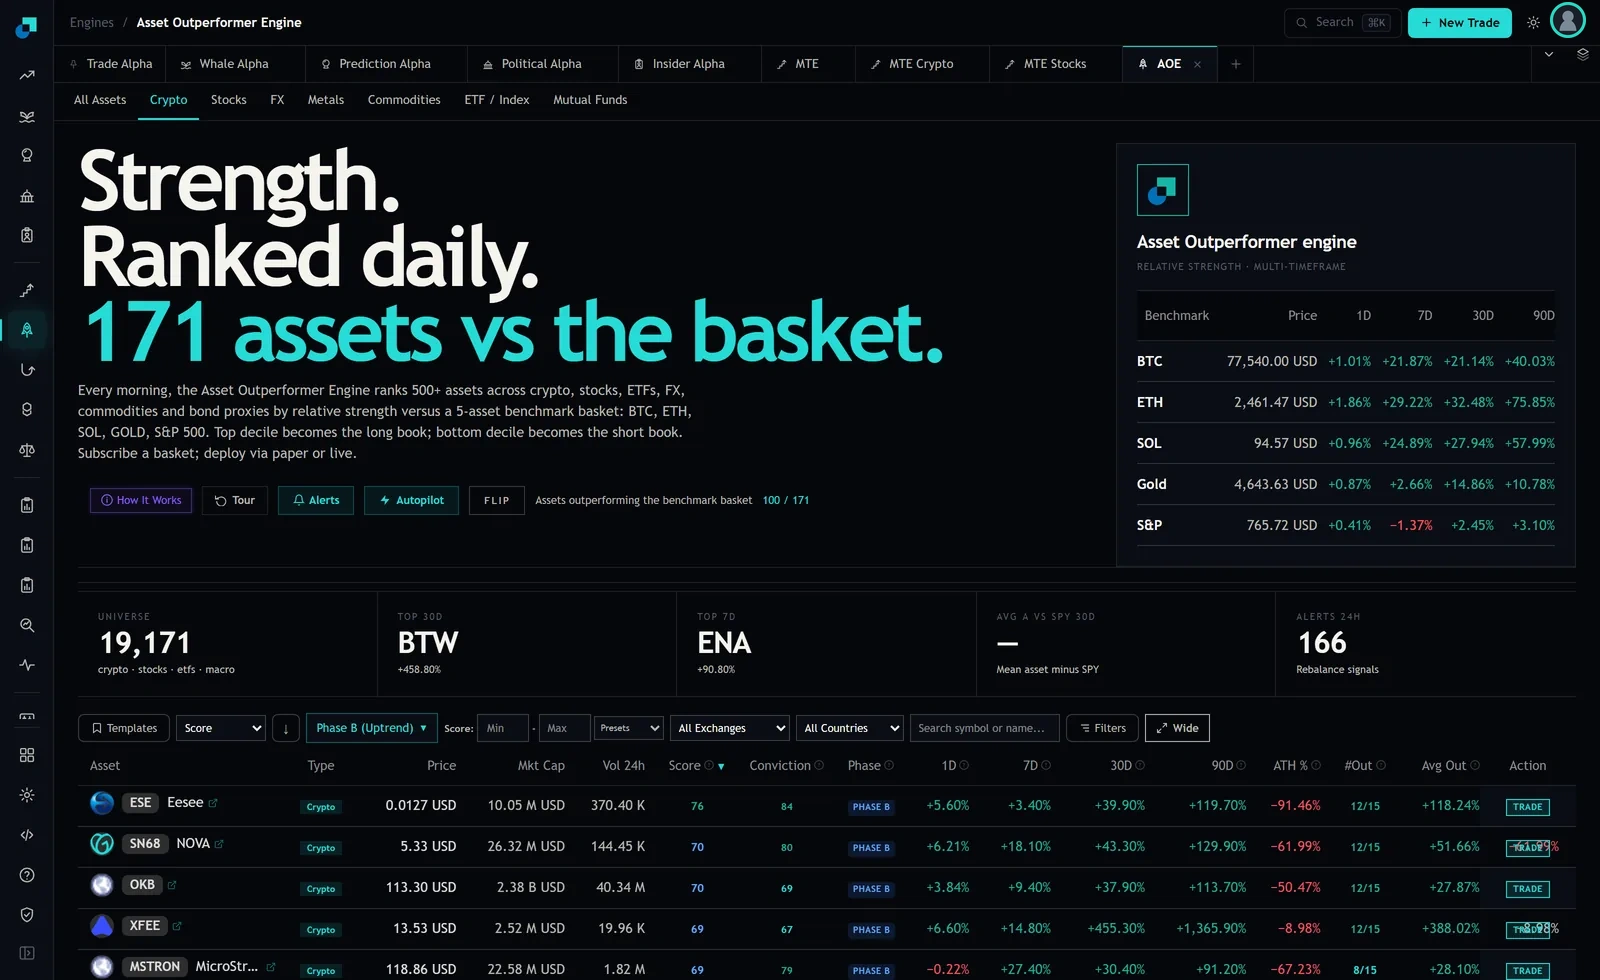
The top row on the crypto board at capture was Eesee, scoring 76, the highest on the tab. Four columns to the right, on the same row, the ATH % cell read minus 91.46 percent. Both numbers are correct and they are describing different assets in every sense that matters to a risk committee.
A relative strength rank is a statement about the last few weeks measured against a benchmark basket. Distance from all-time high is a statement about everything that has happened to the asset since it existed. Funding the first without reading the second is how a sleeve ends up holding the strongest performers inside a cohort of things that have already been destroyed once.
What the ATH % column is, and what it is not
Be precise about the field, because the imprecision is where the risk process leaks. ATH % is the current price expressed as a distance from the highest price the asset has recorded. It is a point-in-time reading. It tells you how far below the peak you are standing right now.
Maximum drawdown is a different statistic. It is the worst peak-to-trough decline over a defined window, and it is a property of the path rather than of the current price. The two coincide only in the case where today happens to be the trough. An asset that fell 95 percent and has since tripled shows a max drawdown of 95 percent and a distance from high of 85 percent, and those two numbers support quite different conclusions about what the position is.
The board carries the first of those and not the second. There is no max drawdown column on the crypto tab, no realised volatility, no time-below-high and no recovery flag. So if your veto rule is written in terms of maximum drawdown, the board cannot execute it and you should not pretend otherwise in the process document. What the board gives you is a fast, free, universe-wide distance-from-high reading that is good enough to triage on, with the real drawdown work done on your own price history for the names that survive triage.
The recovery arithmetic nobody says out loud
Distance from high converts directly into the gain required to get back to that high, and the conversion is violently non-linear at the deep end. The five crypto rows visible at capture make the point without any help.
| Asset | Score | ATH % | Gain required to recover the high |
|---|---|---|---|
| Eesee | 76 | minus 91.46 | about 1,071 percent |
| NOVA | 70 | minus 61.99 | about 163 percent |
| OKB | 70 | minus 50.47 | about 102 percent |
| Tokenized MicroStrategy | 69 | minus 67.23 | about 205 percent |
| XFee | 69 | minus 8.98 | about 10 percent |
Seven points of score separate the top and bottom of that table. Two orders of magnitude separate the recovery requirements. The reason this matters operationally is not that the high is a target, because for most of these assets it never will be. It is that the size of the required recovery is a proxy for how much of the asset's original holder base is sitting on a loss, and therefore for how much overhead supply sits above the current price waiting to be sold into any rally. That is a structural feature of the position, it is not visible anywhere in the score, and it will show up in your execution costs on the way out rather than on the way in.
Why the rank is structurally blind to this
The score is built from returns over short lookbacks against the benchmark basket. Every input is a recent relative measurement. Nothing in that construction can see the level from which the asset is measuring, which means a token that fell 95 percent and then bounced 40 percent scores exactly like a token that never fell and rose 40 percent.
Worse, the bias runs the wrong way. Deeply impaired assets are precisely the ones capable of printing the large short-window percentage moves that relative strength rankings reward, because their price base is small. So a pure rank does not merely fail to screen for drawdown, it actively selects for it, and the effect concentrates at the top of the board where your sleeve is shopping.
That is the argument for treating the drawdown field as a veto rather than as a factor. A veto is applied before ranking and it does not trade off against score. Blending distance from high into a composite score sounds more sophisticated and is worse, because a blend lets a sufficiently high rank buy its way past a survivability problem, and survivability is not a quantity you should let anything buy its way past.
Setting the cut, and being honest about what it costs
A veto needs a number, and any number you choose will be wrong in individual cases. Say the rule is that no name more than 80 percent below its all-time high is eligible for the sleeve. On the board at capture that vetoes Eesee, the top-ranked asset on the tab, and admits everything else in the visible top five.
You have to be able to defend that trade in a review, so state the cost explicitly rather than letting it emerge later. Vetoing the deepest names removes the fattest right tail from the distribution, because the assets capable of the largest multi-hundred percent recoveries are by construction the ones that fell furthest. The sleeve will therefore underperform an unconstrained version of itself in exactly the periods when impaired assets rally hardest, and that underperformance is the premium you are paying for a return distribution whose left tail is survivable. Write that sentence into the strategy document before the first drawdown, not after.
Two refinements make the veto less blunt without softening it. First, apply a size taper rather than a single cliff, so names between 60 and 80 percent below their high are eligible at reduced weight rather than fully in. Second, pair the field with liquidity, because a deep drawdown on a name with real turnover is a different proposition from a deep drawdown on a twenty thousand dollar daily tape, and the combination of both is the cohort where positions become genuinely unexitable.
Where the column stops being usable
Two limitations belong in the control documentation. The first is coverage. The ATH % column is populated with real readings across the crypto tab, but on the US stocks tab at capture every visible row read 0.00 percent. A veto keyed to a column that is not populated on a given tab does not fail loudly, it passes everything, which is the most dangerous failure mode a control can have. Test the field for null and zero behaviour on every tab you intend to run the screen on, and alert when the distribution of a supposedly varied column collapses to a single value.
The second is that an all-time high is only as long as the asset's history. A token that listed four months ago has a four month high, so a small distance from it means very little and a large one means the launch failed. Pair the reading with listing age before it enters a risk report, or the screen will systematically wave through new assets that have simply not had time to fall yet.