Research hands the desk a view with a two million dollar target attached. In most asset classes the first question is how to work it. Here the first question is prior to that: can two million dollars of this instrument exist at all, and if not, what does the difference get expressed in.
Answering that before the trade rather than during it is the entire discipline. A view that is half implemented and half hedged with something correlated is a different position from the one that was approved, and nobody involved will remember that clearly six months later.
Three constraints, and only one of them is on the screen
Three things stand between the target and the fill. Per account position caps set by the venue. Order or ticket size limits, also set by the venue. And book depth, which is set by whoever happens to be resting orders when you arrive.
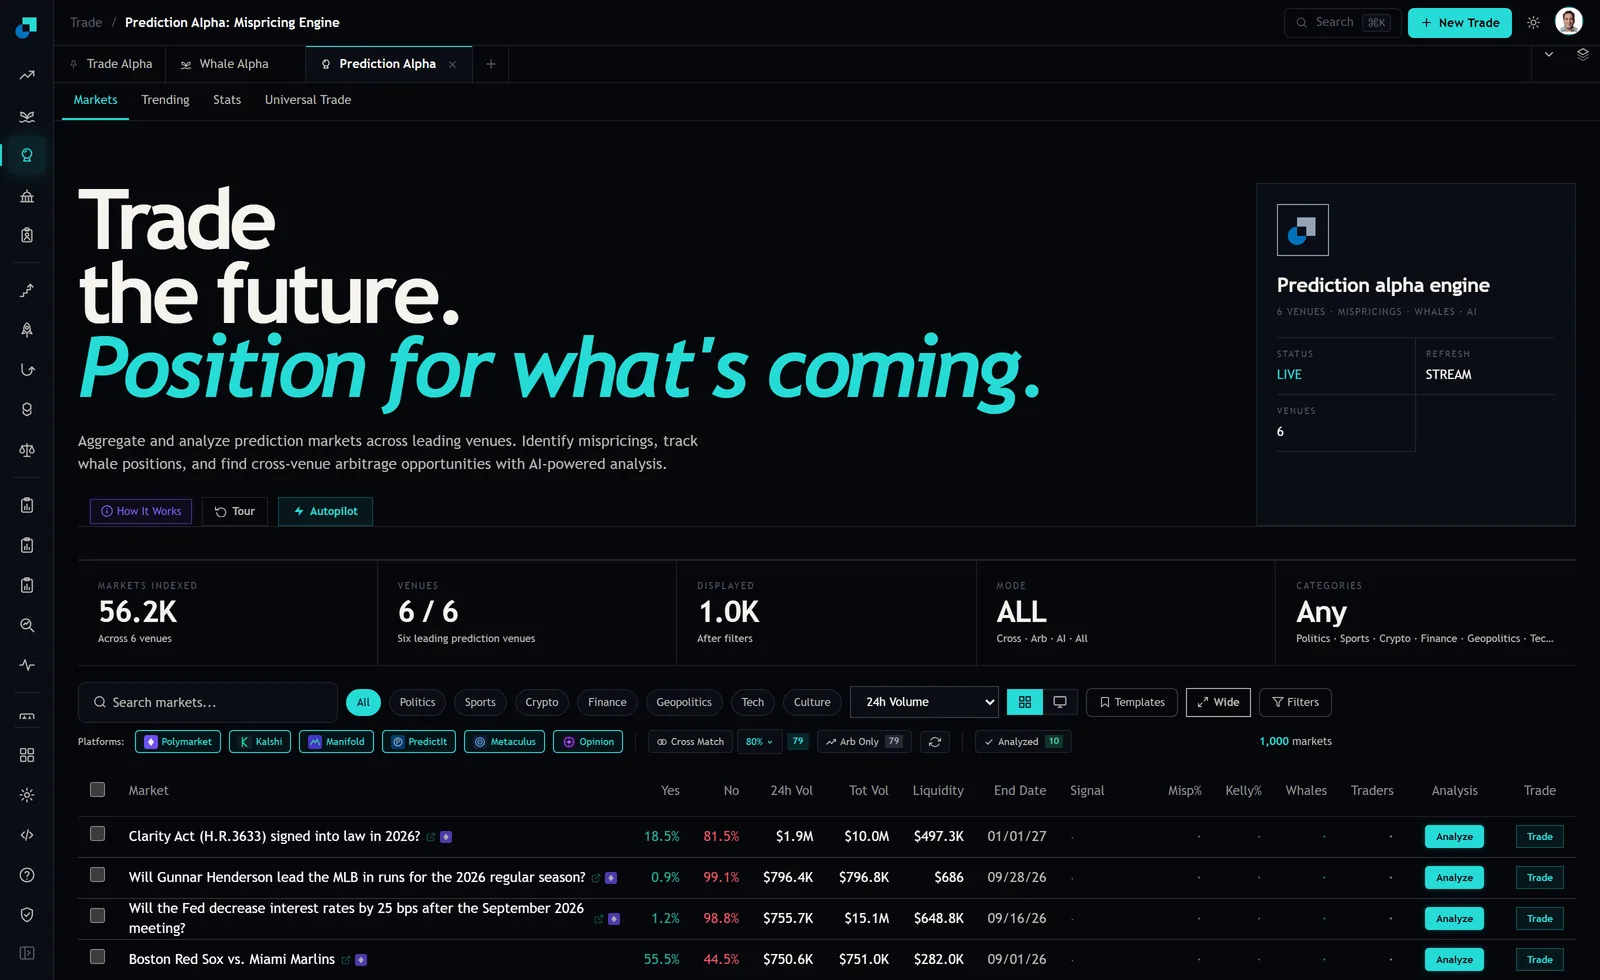
The markets tab shows you the third and says nothing about the first two. There is a Liquidity column on every row. There is no field anywhere in the feed for a position cap, and there could not be, because caps are terms of service rather than market data.
I am not going to quote cap figures. They are operator parameters, they differ by account type, they differ by whether the venue considers you retail or institutional, and they change. Get them in writing from each venue, dated, before the first order, and record where they came from. The point of the rest of this is that on the depth evidence available, the caps are usually not what binds first anyway.
Walking two million into the observed books
Take the most favourable case available anywhere in this module. The trending tab's highest liquidity tile reads 4.7M. Against that, a two million dollar order is 43 percent of the entire resting book, and that is the single deepest thing on the platform on the day of capture.
Now take the realistic case. The four rows in the screenshot are among the highest turnover markets in the feed and they carry 497.3K, 686 dollars, 648.8K and 282.0K of resting depth. Against 497.3K, two million dollars is four times the book. Not forty percent of it, four times all of it.
There is no execution algorithm that resolves that gap. Working the order over days does not summon depth that was never there, and on this instrument it introduces two costs that are specific to event contracts. You leak information into a market where the number of participants is small enough that a persistent bid is conspicuous. And you spend time against a fixed resolution date, so every day of patient execution is a day of the thesis window consumed by implementation rather than by the position.
Why impact on a binary is not a slippage line
This is the part that does not transfer from equities and it changes the size of the decision.
On a fixed payoff instrument, the price you pay is your maximum return. A contract bought at 0.30 that pays one dollar has a ceiling of 233 percent. Let impact drag your average fill to 0.38 and the ceiling falls to 163 percent. You have not been wrong about anything yet. You have simply spent 30 percent of the strategy's entire upside on getting in, and you will spend more on getting out unless you hold to resolution.
In cash equities, impact is a drag on a return distribution that is unbounded above. Here it is a direct reduction of a hard ceiling, which means the capacity calculation and the return calculation are the same calculation. Any expected return figure in a research note that was computed at the quoted price rather than at a realistic average fill is not conservative, it is wrong, and the gap widens with size.
Make that explicit in the note. Two numbers: expected return at the quote, and expected return at the average fill implied by walking the observable book at the intended size. If the second is not stated, the size has not been evaluated.
Splitting across venues is available less often than it looks
The obvious response is to split the order across venues. The obvious response runs into the coverage figure on the stats tab of the same module, which reports average coverage of 0.8 percent across 33,737 indexed markets. The overwhelming majority of questions exist in exactly one place, so cross venue splitting is available on a small minority of the universe and never on demand.
Where it is available, be clear about what you have bought. Two listings of the same question on two venues are two contracts under two rulebooks, with two sets of resolution criteria, two fee schedules, two funding rails and two counterparty exposures. That is not one position split in half. It is two related positions, and they can settle differently on the same real world outcome, which is precisely the scenario that turns a capacity solution into a basis loss.
So the split is real, it is useful, and it is a decision that requires somebody to have read both sets of criteria to the end. It is not a routing setting.
The residual, and what it honestly gets expressed in
Assume you have worked all of that and can express perhaps three hundred thousand dollars of a two million dollar view. Three options exist for the remainder and only one of them is quiet.
Express it in the underlying if an underlying exists. Some event views have a listed proxy with real depth, and where the proxy is honest this is the right answer even though it is a different instrument with different sensitivities. Say in the note that it is a proxy.
Express a correlated but non identical exposure and label it as such in the book. This is legitimate when it is declared and dangerous when it is not, because the correlated position will be reported against the original thesis and will be judged by whether the event happened rather than by whether the proxy worked.
Or return the capital and report the capacity number. This is the underused option and usually the correct one. A view with three hundred thousand dollars of capacity is a three hundred thousand dollar idea, and forcing two million into it converts a good trade into a bad one through nothing but sizing.
The process change that makes all of this work sits earlier than any of it. Put the capacity estimate in the research note before approval, computed by walking the observable book at the intended size, and make it a required field. An idea that arrives at the allocation meeting with a two million dollar target and no capacity line has skipped the step where somebody could still have said no cheaply.