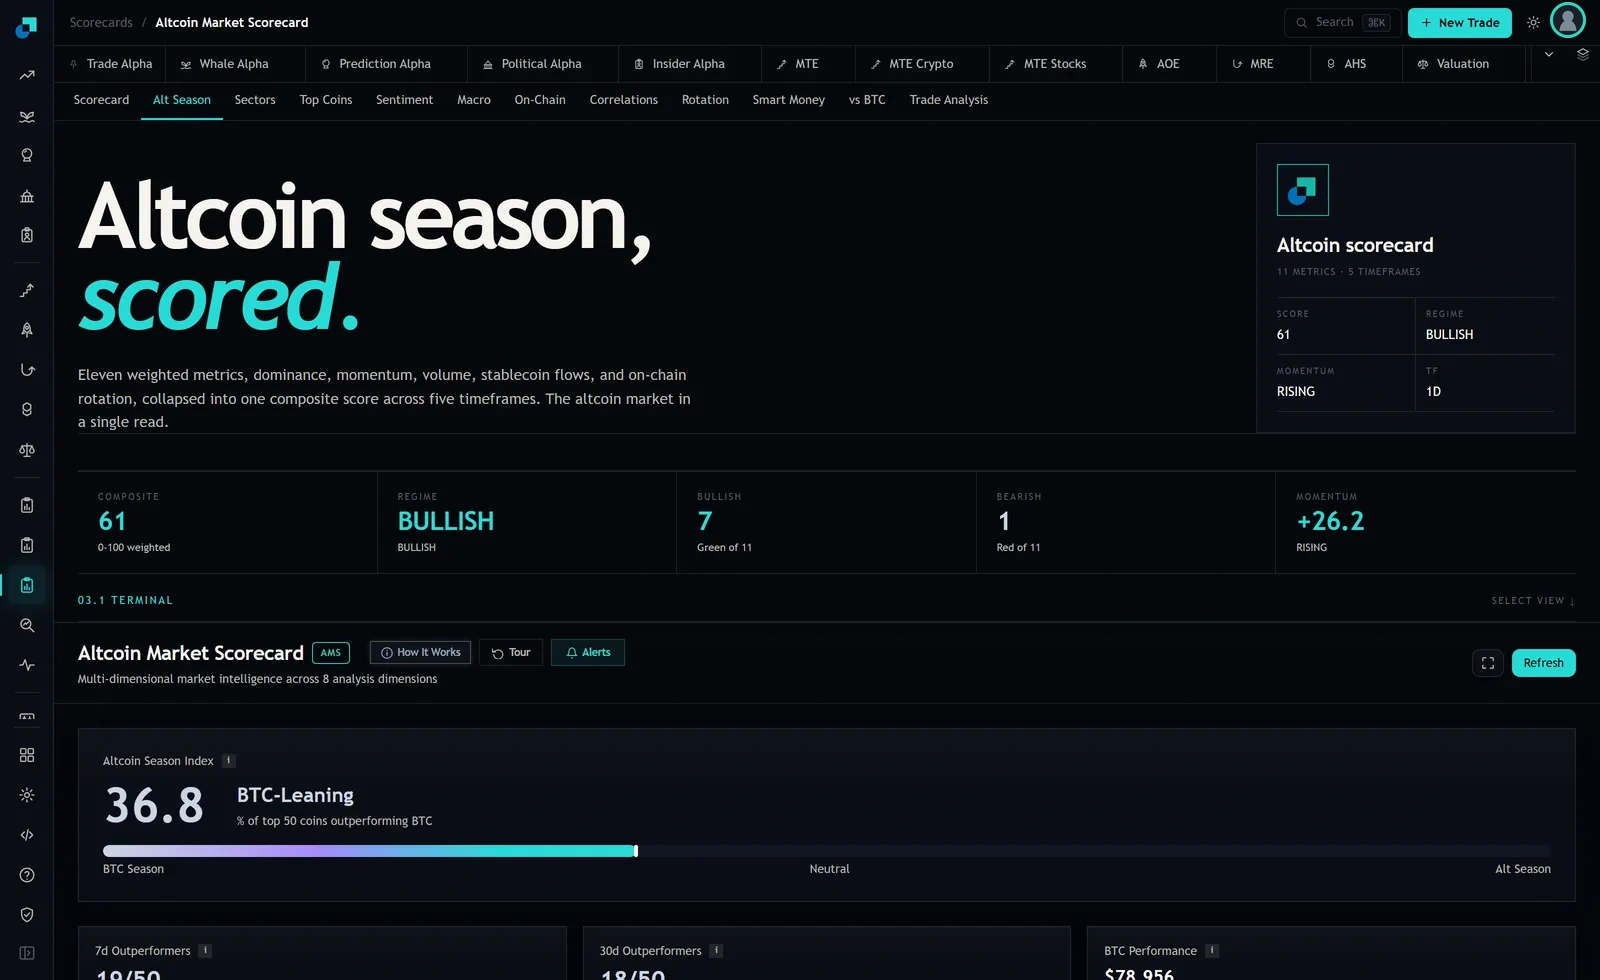
The Alt Season Index in the scorecard measures the percentage of the top 50 altcoins outperforming Bitcoin. The module says so outright in its analysis dimensions, which is more disclosure than most breadth measures offer. The arithmetic is not the problem. The problem is that its universe was selected by market capitalisation rank, and your universe was selected by a mandate, a custody policy, an approved venue list, and a minimum trade size you can clear without paying for the privilege.
Those two sets overlap. They are not the same set, and the difference between them is directional rather than random, which is the part that matters for anything you put in a client note.
The membership rule is doing more work than the counting rule
A top-50 breadth statistic has two components, and only one of them gets discussed. The counting rule is trivial: over a lookback window, count the constituents whose return exceeded Bitcoin's, divide by the count of constituents. The membership rule is where the judgement lives, and cap rank is a strong opinion disguised as a neutral default.
Cap rank refreshes on the same variable the index is trying to measure. A name sitting at rank 45 during a broad alt rally may have been at rank 90 two months earlier, and it got into the universe by outperforming. Membership is therefore correlated with the property being counted, which biases the reading upward in rallies and downward in liquidations. This is not a defect anyone hid. It is what a rank-based universe does, and it is why a vintage record of the constituent list matters as much as the reading itself.
The second issue is that cap rank is silent about everything a desk cares about. It says nothing about free float, about which venues list the asset, about whether your custodian supports the chain, about borrow, or about average daily volume relative to the clip you would actually need to put on. A name can sit comfortably in the top 50 by capitalisation and trade in a book where your minimum position is a week of volume.
Three screens, and where each one gets set
Rebuilding the statistic over an investable universe means writing down three cutoffs and defending each in the note.
The first is a liquidity floor, expressed as a ratio rather than a dollar figure. Take your intended per-name position at target sleeve size, divide by trailing median daily dollar volume, and keep names where that ratio sits under whatever participation you are willing to accept. A desk targeting a 40 basis point position in a 300 million dollar sleeve is sizing 1.2 million dollars per name, and if you will not exceed 10 percent of a day's volume, the floor is 12 million dollars of median daily volume. Write the arithmetic, not the round number, because the floor moves when the sleeve does.
The second is venue and custody eligibility. This is binary and it belongs in the universe definition rather than in a footnote, because an asset you cannot settle is not an asset that can contribute to a breadth reading you intend to act on.
The third is a cap tier structure. An unconstrained investable universe tends to concentrate in whichever tier is currently liquid, which means your breadth number quietly becomes a large-cap breadth number in quiet markets and a mid-cap one in hot ones. Banding the universe, so that no tier contributes more than a set share of constituents, keeps the statistic comparable across quarters.
Decomposing the gap between the two readings
Once you have both numbers, the useful output is not the mandate reading on its own. It is the decomposition of the difference, because that is the sentence a committee can interrogate.
Split the two universes into three buckets. Bucket A is names in both. Bucket B is names in the top 50 that your screens excluded. Bucket C is names your screens admitted that sit outside the top 50. The reference reading is the hit rate across A plus B, weighted by their counts. The mandate reading is the hit rate across A plus C. The gap between the readings is therefore entirely explained by how the hit rate in B differs from the hit rate in A, how the hit rate in C differs from the hit rate in A, and the relative sizes of the three buckets. Report those six figures and the delta is no longer a mystery number.
I am deliberately not quoting a measured divergence here, because I do not have a sourced one to give you and a plausible-looking figure would be worse than none. What I will say is which direction the arithmetic pushes. Excluded names skew small and thin, and thin small-caps carry higher beta to alt rallies, so bucket B tends to have a higher hit rate than bucket A when the tape is up and a lower one when it is down. The consequence is structural: an unscreened cap-rank breadth reading should be expected to run more cyclically than the investable version, printing higher highs in rallies and lower lows in liquidations. Test that on your own vintages before you assert it in a note, but design your reporting expecting it.
Sample size, and why the mandate reading needs quantising
A screened universe is smaller, and small denominators produce false precision. If your screens leave 44 names, one constituent flipping is worth 2.3 points on the reading. Reporting a move from 56.8 to 54.5 as a change in market breadth is reporting one asset having a Tuesday.
Two fixes. Quantise the published reading to the granularity one name buys you, so the number cannot imply resolution the denominator does not support. And publish the constituent count next to the reading every single time, because a reading of 60 over 44 names and a reading of 60 over 31 names are not the same claim, and a reader six months from now has no way to reconstruct which one they were given.
The screens move too, and that is the failure mode nobody plans for
A liquidity floor is procyclical. Volume rises in rallies, so more names clear the floor precisely when the alt tape is hot, which means your universe expands mid-move and the newly admitted names are the ones that just outperformed. You have reintroduced, through the back door, the same selection bias you rebuilt the statistic to remove.
The mitigations are unglamorous. Measure volume over a long trailing window so that a fortnight of excitement does not qualify a name. Rebalance the universe on a fixed calendar, quarterly is defensible, rather than continuously. Archive the constituent list at every rebalance with the screen parameters that produced it, so a reading from two quarters ago can be reproduced exactly rather than approximately.
And accept the last constraint honestly, because it will come up at review. Your floor is a function of your own size, so your breadth reading is not comparable with another desk's and not comparable with your own from before the sleeve grew. When the sleeve doubles, the floor doubles, the universe shrinks, and the series breaks. That break belongs in the note with a date on it, not discovered later by whoever is asked why the number jumped in a week when nothing happened.