Whichever field you sort a leaderboard by is the field you are selecting on, and most people never make that choice deliberately. They open the board, glance at the top row, and take the strategy that a default ordering happened to promote. The ordering does more work than the reading that follows it, so it is worth ten minutes to understand what each option actually pulls to the top.
The short version is that a return sort promotes leverage, a Sharpe sort is blind to leverage, and the sort that would tell you about survivability is not in the menu.
What the board offers, and one thing it does not
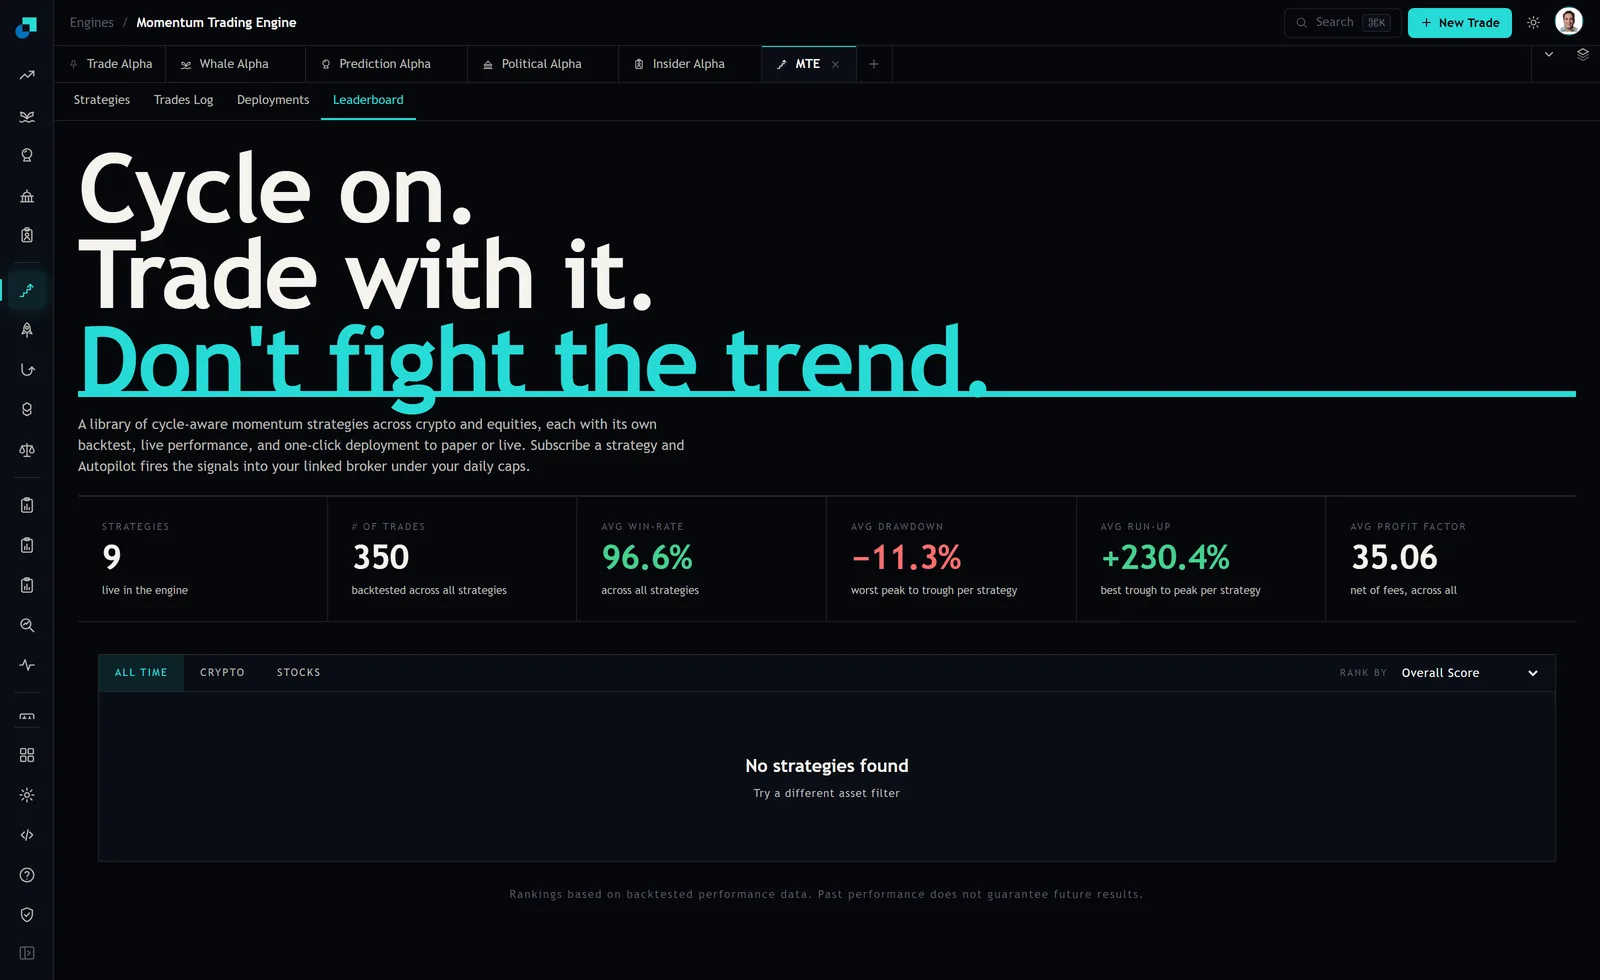
The leaderboard tab has two controls. On the left, scope tabs for ALL TIME, CRYPTO and STOCKS. On the right, a RANK BY dropdown, set to Overall Score at capture, with options for Overall Score, Total Return, Risk-Adjusted Return, Win Rate, Alpha and Profit Factor. Underneath, at capture, the board itself was empty, reading no strategies found and suggesting a different asset filter. At the foot of the page sits a line stating that rankings are based on backtested performance data and that past performance does not guarantee future results.
Here is the discrepancy worth knowing about before you go looking for it. The engine's feature list describes a public leaderboard ranking all deployments by return, Sharpe, drawdown and win rate. The control I looked at offers six orderings and drawdown is not one of them. Risk-Adjusted Return is the Sharpe-style option, Total Return is the return option, Win Rate is there, and the remaining two are Alpha and Profit Factor. So if you want to rank by the thing that decides whether you can hold a position through a bad month, the board will not do it for you and you will be reading drawdown per strategy yourself.
Why a return sort is really a leverage sort
This is the arithmetic that changes how you use the board, and it is short.
Take a strategy that returns 20 percent with a volatility of 20 percent, so its ratio is about 1.0 and its worst drawdown is 15 percent. Now take the identical strategy run at twice the size. Returns double to 40 percent. Volatility doubles to 40 percent. The ratio is still about 1.0. The drawdown roughly doubles to 30 percent.
Sort those two by Total Return and the leveraged one wins by a mile. Sort them by Risk-Adjusted Return and they tie, because the ratio does not notice size at all. There is no skill difference between them. There never was. The return sort simply ranked the one that took more risk to express the same idea.
Put a dollar figure on what you just selected. On a 10,000 dollar account, the first version has you down 1,500 dollars at its worst point and the second has you down 3,000 dollars. Both recover, in the backtest. Whether you are still holding at that point is a question about you, not about the strategy, and the return sort has quietly moved you towards the version most likely to get closed at the bottom.
So the practical rule is that a return sort is only informative when everything on the board runs at the same size and the same leverage, which on a mixed board of crypto and equity strategies is not true.
What Sharpe promotes, and what it refuses to tell you
Risk-Adjusted Return is the better default and it is not the answer. It rewards smoothness, which is what you want, and it is indifferent to leverage, which is a feature when you are comparing ideas and a hole when you are deciding what to hold.
Two specific blind spots. Because the ratio ignores size, a top-ranked strategy can have a drawdown you cannot live with, and nothing in the ordering will hint at it. And because the ratio is estimated from a sample, it is inflated by strategies whose losses simply have not happened yet in the window measured. A strategy that makes a little every week and occasionally gives back a year of gains shows a magnificent ratio right up until the week it does not.
That matters here because of sample length. The engine reports 350 trades backtested across nine strategies, which is roughly 39 trades each. A ratio computed on that many observations carries a standard error of about a quarter of a unit, so two strategies displayed at 1.6 and 1.3 are not distinguishable. You are sorting on differences the data cannot support, which is a reason to use the ordering to build a shortlist rather than to pick a winner.
The win rate and profit factor sorts are the ones to be careful with
Both of these look like quality measures and both are dominated by how few losses happened to occur in a short sample.
Start with the engine's own figure: an average win rate of 96.6 percent across all strategies. Now take a strategy with 39 trades and a true win rate of 96 percent. The standard error on that estimate is about 3 percentage points. So a board that displays one strategy at 94 percent and another at 100 percent is displaying two numbers that are inside one standard error of each other, and a win rate sort will rank them confidently anyway. You would be choosing on noise.
Profit factor has the same problem in a sharper form. It is gross profit divided by gross loss, and the engine's average profit factor tile reads 35.06 net of fees across all. A figure that size means the denominator is tiny, which means very few losses, which means one ordinary future loss can cut the number by an order of magnitude. Sorting on it promotes whichever strategy has been luckiest about avoiding losses so far.
None of this makes the numbers wrong. They are what the backtests produced. It makes them unsuitable as a ranking key, which is a different complaint and one the board's own footer half concedes when it says rankings are based on backtested performance data.
The order to use the board in this week
Five steps, and the first one is the one people skip.
Set the scope first. Choosing CRYPTO or STOCKS before you sort means you are comparing things that face the same conditions, and it also shrinks the pool, which matters because the top of a large pool is more contaminated by luck than the top of a small one.
Sort by Risk-Adjusted Return and take the top five as a shortlist, not as a ranking. Treat the order within those five as meaningless.
Open each of the five and read the trade count first, before any performance figure. Anything with a couple of dozen trades behind it cannot support the precision the board displays, and knowing that upfront stops you arguing yourself into it later.
Then read the drawdown for each of the five yourself, since the ordering will not do it, and convert it into dollars on your actual account size. This is the number that decides whether you will still be holding the position at the point where the backtest says you should be. Reject anything whose worst historical drawdown, in dollars, is a number you would not sit through calmly, no matter where it ranked.
Finally, check whether the survivors are the same trade. Four crypto momentum strategies that all rank well are frequently one bet expressed four ways, and a shortlist built by sorting will tend to cluster, because the same market conditions produced all the top records. Spreading across the top five of a single sorted list feels like diversification and often is not.