Stablecoin net issuance is one of the few crypto series with a clean economic interpretation. A dollar minted is a dollar that entered the system through a banking rail, and a dollar redeemed is a dollar that left. If you are running any kind of liquidity or dry-powder input in a risk model, that flow is the input you want, because it is the one with an external counterparty on the other side of it.
The series most desks actually use is not that. It is a sum of chain-level balances, and a sum of chain-level balances grows when tokens move as well as when tokens are created. The gap between the two is not small in periods when a new chain is being incentivised, which happens to be exactly the periods when someone will quote the number in a meeting. This is the netting problem, and it is worth being precise about because the error runs in one direction and it correlates with risk appetite, which is the worst possible property for a measurement error to have.
Three transfer mechanics that look identical in a supply chart
The distinction that matters is what happens to the token on the origin chain.
Lock and mint. A canonical bridge takes custody of the asset on chain A and issues a wrapped representation on chain B. The chain A balance does not fall, because the tokens are locked in a contract rather than burned. If your data pipeline sums balances across chains, you have just recorded growth that corresponds to zero new dollars. This is the pure double count and it is the one that inflates aggregates the most.
Burn and mint. An issuer-operated cross-chain transfer burns supply on chain A and mints an equal amount on chain B. Total supply is unchanged, but both chain-level series move, one down and one up. Aggregate is correct here. Any per-chain attribution built on top of it is not, and per-chain attribution is usually the point of the exercise.
Genuine mint and redeem. A market maker wires fiat to the issuer and receives tokens, or returns tokens for fiat. Only this one is new dry powder. Only this one has anything to say about capital entering or leaving the asset class.
All three produce the same visual on a supply chart. If your source is a chain indexer summing balances, the first two are indistinguishable from the third without deliberate work.
Where the scorecard leaves the netting to you
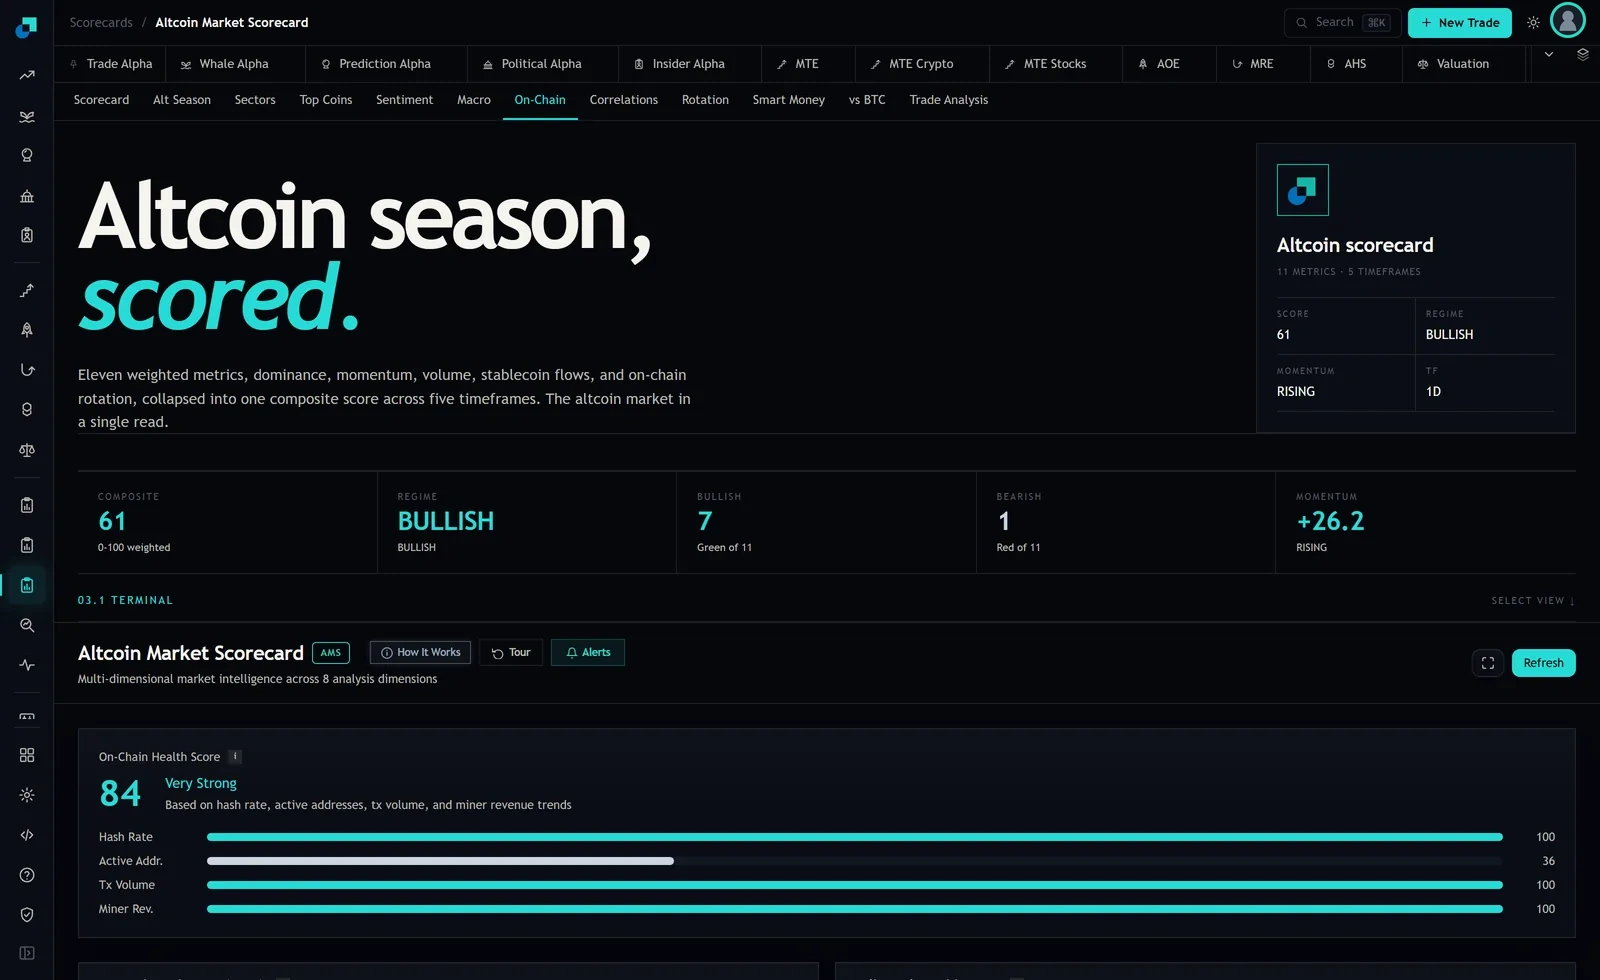
Stablecoin Flows and Exchange Reserves both sit in the eleven weighted metrics behind the headline composite, which on this capture reads 61 with a Bullish regime, 7 of 11 metrics green, 1 red, momentum plus 26.2. The On-Chain tab itself leads with a separate network-health score of 84 over four bars, Hash Rate 100, Active Addr. 36, Tx Volume 100 and Miner Rev. 100.
I cannot confirm from the surface what netting convention sits behind the stablecoin metric, and I am not going to guess on your behalf. There is a How It Works control on the module and that is the first place to look before anything gets cited in a note. The operating assumption for a research process should be the conservative one. A metric whose construction you have not verified is a metric you can use directionally and cannot use in attribution, and the difference between those two uses is the difference between a colour on a dashboard and a number in a committee pack.
The netting procedure
Five steps, in order, each of which is a place your current pipeline may already be losing the distinction.
- Anchor on the issuer, not the chain. Take authoritative issued supply per asset from the issuer's own attestation or treasury contract, not from a sum of observed balances. This is your control total and every later step reconciles to it.
- Classify every representation. For each asset on each chain, record whether the local token is issuer-native or a bridged representation, and which bridge issued it. Bridged representations are excluded from the issuance series entirely. They are not supply, they are claims on supply already counted.
- Net the intra-issuer transfers. Burn-and-mint moves should net to zero at the aggregate level by construction. If they do not, you have a timing artefact from the burn and the mint landing in different snapshot windows, and you fix it with a same-timestamp reconciliation rather than by smoothing.
- Reconcile the residual. Control total minus the sum of issuer-native chain balances should be small and stable. When that residual jumps, something changed in your representation map, usually a new deployment or a bridge you have not classified. Treat an unexplained residual as a data incident, not as a signal.
- Publish the netted series with its own revision policy. State how many days of the tail are provisional. Attestations and indexers both restate, and a series that silently revises will make your backtest look better than the live version can be.
What the netted series supports and what it does not
After netting you have a genuine issuance flow, and the honest description of its usefulness is narrower than most notes imply. It is a slow, low-frequency measure of capital entering or leaving the asset class. It has a coarse time resolution, because minting is batched by market makers around their own inventory needs rather than around the market. Its lead behaviour is not something I am going to assert without a study in front of me.
What it is genuinely good for is checking a story. When a desk argues that a rally is driven by new money, netted issuance either supports that or it does not, and that is a falsifiable claim you can put in writing. Un-netted supply cannot do this, because during a chain incentive programme un-netted supply rises for reasons that have nothing to do with new money and everything to do with tokens moving to the venue paying the most.
The second use is defensive, and it is the one I would flag to a risk committee. If your dry-powder input is un-netted, it is systematically biased upward during migration episodes, and migration episodes cluster with risk-on periods. Your liquidity input therefore looks best exactly when it is least reliable. That is a pro-cyclical measurement error, and pro-cyclical measurement errors are how a model that tested well ends up sized wrong at the top.
The parts of this that stay broken
Netting removes the double count. It does not tell you where the netted dollars went, and location is a separate and equally load-bearing question. It does not resolve the attribution problem for burn-and-mint flow, so per-chain liquidity claims remain soft even after a clean aggregate.
It also does not distinguish a mint that funds real buying from a mint that funds market maker inventory expansion, and those two have very different implications for what happens next. If you want that, you have to follow the minted tokens to their first venue, which is a materially harder pipeline and one worth costing before you commit to it. Say that in the methodology note rather than letting the reader assume the series carries more resolution than it does.