After a decent quarter the useful question is not which positions made money. It is which of the mechanisms in the sleeve made money, because mechanisms are what you allocate to next quarter and positions are not. If your attribution comes back saying that Ford and silver did the work, you have produced a list of outcomes rather than an explanation, and the sleeve will be sized next quarter on the basis of two tickers that happened to trend.
The Momentum Trading Engine documents eleven distinct entry systems spanning momentum, breakout and mean reversion, running across five synchronised timeframes. That is the axis a review should be cut on. The obstacle is that the trade log is not organised that way, and the join key you need is not in it.
The log's grain is instrument, not mechanism
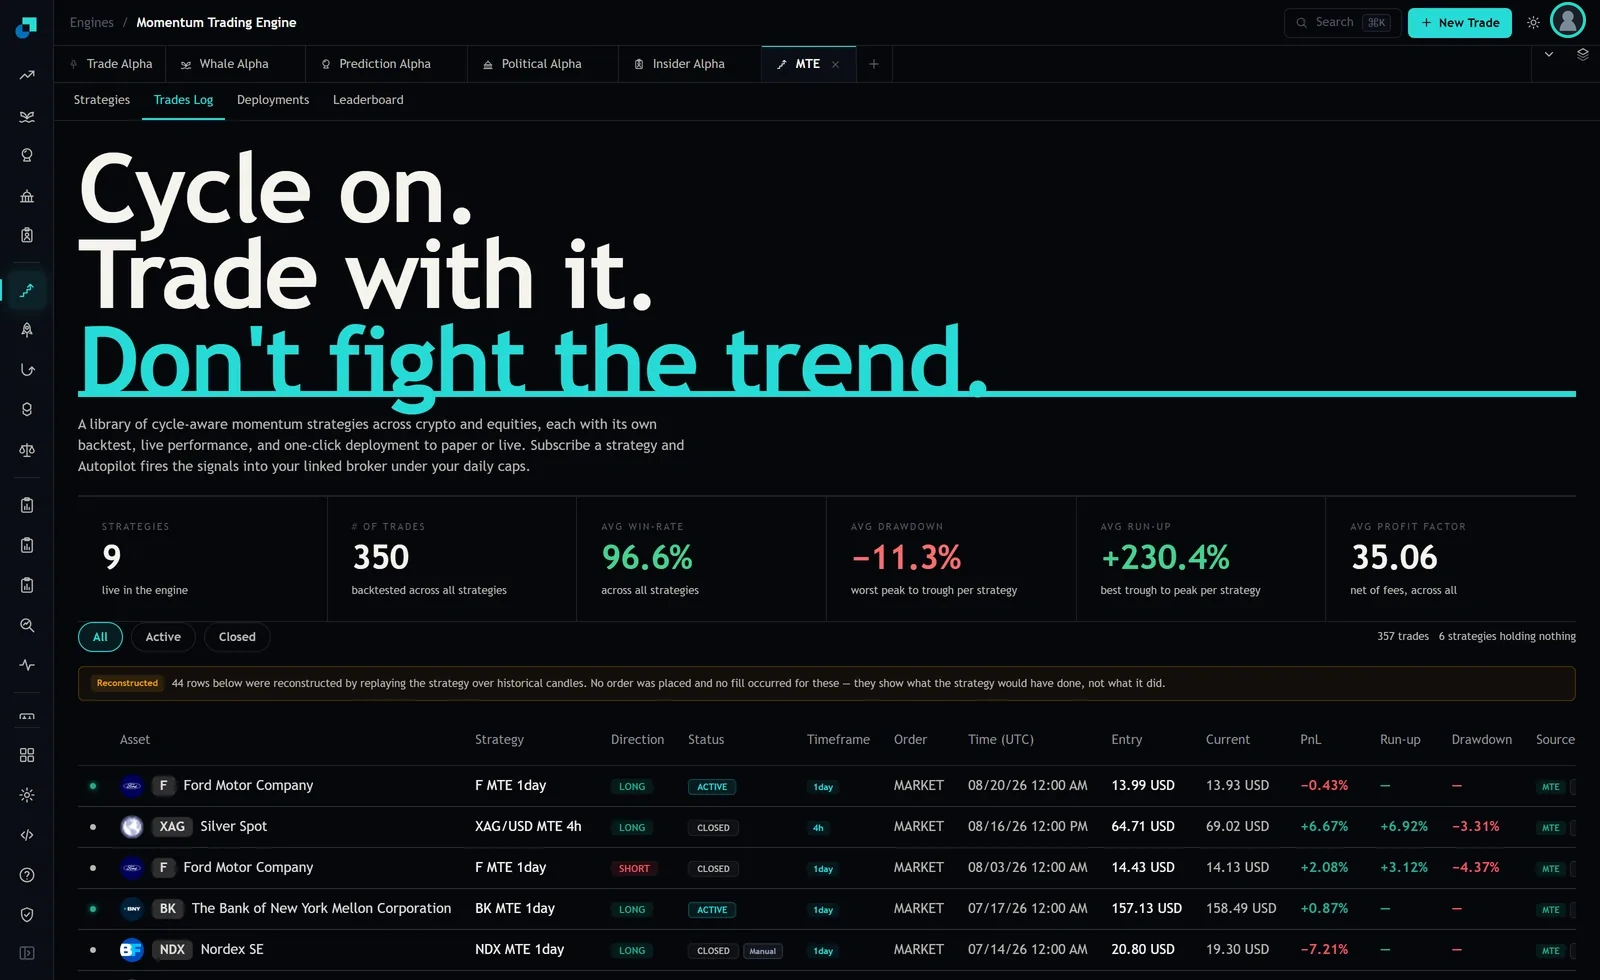
The trades log tab presents rows with these columns: Asset, Strategy, Direction, Status, Timeframe, Order, Time in UTC, Entry, Current, PnL, Run-up, Drawdown, Source and Duration. Above the table sit three filter pills, All, Active and Closed, and a counter that at capture read 357 trades with six strategies holding nothing.
The Strategy column looks like it might be the mechanism axis, but read the values. They were F MTE 1day, XAG/USD MTE 4h, BK MTE 1day and NDX MTE 1day. Every one of those names an instrument and a timeframe. The naming convention is symbol-scoped, which means grouping by Strategy is grouping by ticker with extra steps. You can produce a perfectly clean pivot table off that column and it will still answer the wrong question.
Building the key the log does not carry
The mapping from a deployed row to an entry system has to come from somewhere, and the honest answer is that it comes from you, recorded at deployment time. Nothing in the log recovers it afterwards.
The fields that look like they might substitute do not. Timeframe tells you the bar length, not the rule. The strategies table exposes a Type badge and a tier marker, with six Tier A and three Tier B across nine strategies at capture, but tier is a quality or access classification rather than a mechanism. The table also carries an All Sources filter and the log a Source column, which at capture held values including MTE and MTE Adopted. That is provenance, which is genuinely useful and is not the same thing as which entry rule fired.
So the operational instruction is dull and it is the whole article: at the moment you deploy anything, write down the entry system in your own change record, keyed to the strategy name exactly as it will appear in the log. It costs thirty seconds per deployment and it is not reconstructible later. Every attribution question you will be asked in the next two years depends on that one line existing.
What the regrouping does to your cell counts
Now the uncomfortable part. Suppose you have the mapping and you cut the sleeve eleven ways. Look at what happens to the sample.
The engine reported 350 trades backtested across nine live strategies, which averages to about thirty-nine per strategy. Spread across eleven entry systems, however the allocation actually falls, most cells land in single digits. A finding that two systems produced the sleeve's return, drawn from cells of that size, is not distinguishable from the noise. You can compute it, you can present it, and you must present it with the cell counts next to every number or the reader will treat it as a fact.
Two adjustments before you compute anything. First, the log's amber banner at capture stated that 44 of the rows below were reconstructed by replaying the strategy over historical candles, that no order was placed and no fill occurred for them, and that they show what the strategy would have done rather than what it did. Those rows cannot appear in a realised attribution. On 357 rows that leaves 313. Second, one row was closed with a Manual tag, a Nordex SE long entered at 20.80 USD and marked at 19.30 for -7.21%. Manual closes attribute to a person, not to a system, and they should be tagged as a separate bucket rather than silently absorbed into whichever entry system opened the position.
PnL percent is not a contribution
The log's PnL column is a per-trade percentage. The visible values were -0.43%, +6.67%, +2.08%, +0.87% and -7.21%. Percentages do not sum to a sleeve return without position weights, and the log does not carry a size column, so the weights come from your own order records.
Two further wrinkles that matter for a defensible attribution. The Current column marks open positions to market, so an ACTIVE row's PnL is unrealised and will change; the Ford row was ACTIVE with a duration of 5d 0h and a PnL of -0.43% that means nothing yet. And the Duration column, which carried values like 5d 0h, is what lets you convert per-trade returns into capital-time contributions. A system that produces +6% over four hours on silver and a system that produces +2% over three weeks on a bank are not comparable on the PnL column alone, and the sleeve cares about the second comparison, not the first.
What to do with the systems that did not pay
Assume the cut comes back the way these cuts usually do, with two systems carrying the sleeve and nine contributing roughly nothing or a little less than nothing. Four responses, in descending order of how much I would trust them.
- Separate "did not fire" from "fired and lost". These are entirely different findings and the log distinguishes them: the six strategies holding nothing at capture were not losing, they were waiting. A system with two trades in the period has not been tested; a system with twenty losing trades has been.
- Test whether the two winners are one idea. If both sit in the momentum family and both run on the same timeframe, you have not found two sources of return, you have found one with two labels, and the sleeve is more concentrated than the eleven-way cut suggests.
- Keep the nine at reduced weight with a pre-registered review window rather than cutting them. At single-digit cell counts, killing a system on one quarter is a decision made on noise, and the reversal decision six months later will be made on noise too.
- Write the expected dispersion into the review record before the next period starts. If you state in advance that you expect two or three systems to dominate any given quarter and that the identity of those systems should rotate, then next quarter's result is evidence about the sleeve rather than a surprise requiring a narrative.
One caution on quoting the engine's own headline figures inside an attribution memo. The six tiles above the log reported 9 strategies, 350 backtested trades, a 96.6% average win rate, -11.3% average drawdown, +230.4% average run-up and a 35.06 average profit factor. Those are library-wide backtest aggregates over a short sample, not the performance of your sleeve, and they exclude your financing, borrow, market impact and the delay between a signal timestamp and your fill. They belong in a memo as context for what was deployed, never in the attribution table itself.