An allocator asks for the track record and is sent a leaderboard link. This happens often enough that it is worth being precise about the difference, because the two documents answer different questions and only one of them was built to be audited. A composite is a construction with rules about what goes in, what stays in, and what the numbers are net of. A leaderboard is a ranked view of whatever is currently in the system. Everything an allocator checks lives in the gap between those two sentences.
I want to take the four dimensions that come up in every operational due diligence questionnaire and show, concretely, where a ranked board is silent on each one. The Momentum Trading Engine's leaderboard tab is a useful specimen precisely because it is honest about being a ranking rather than a record. Its own footer says so.
Inclusion, and who decides what appears
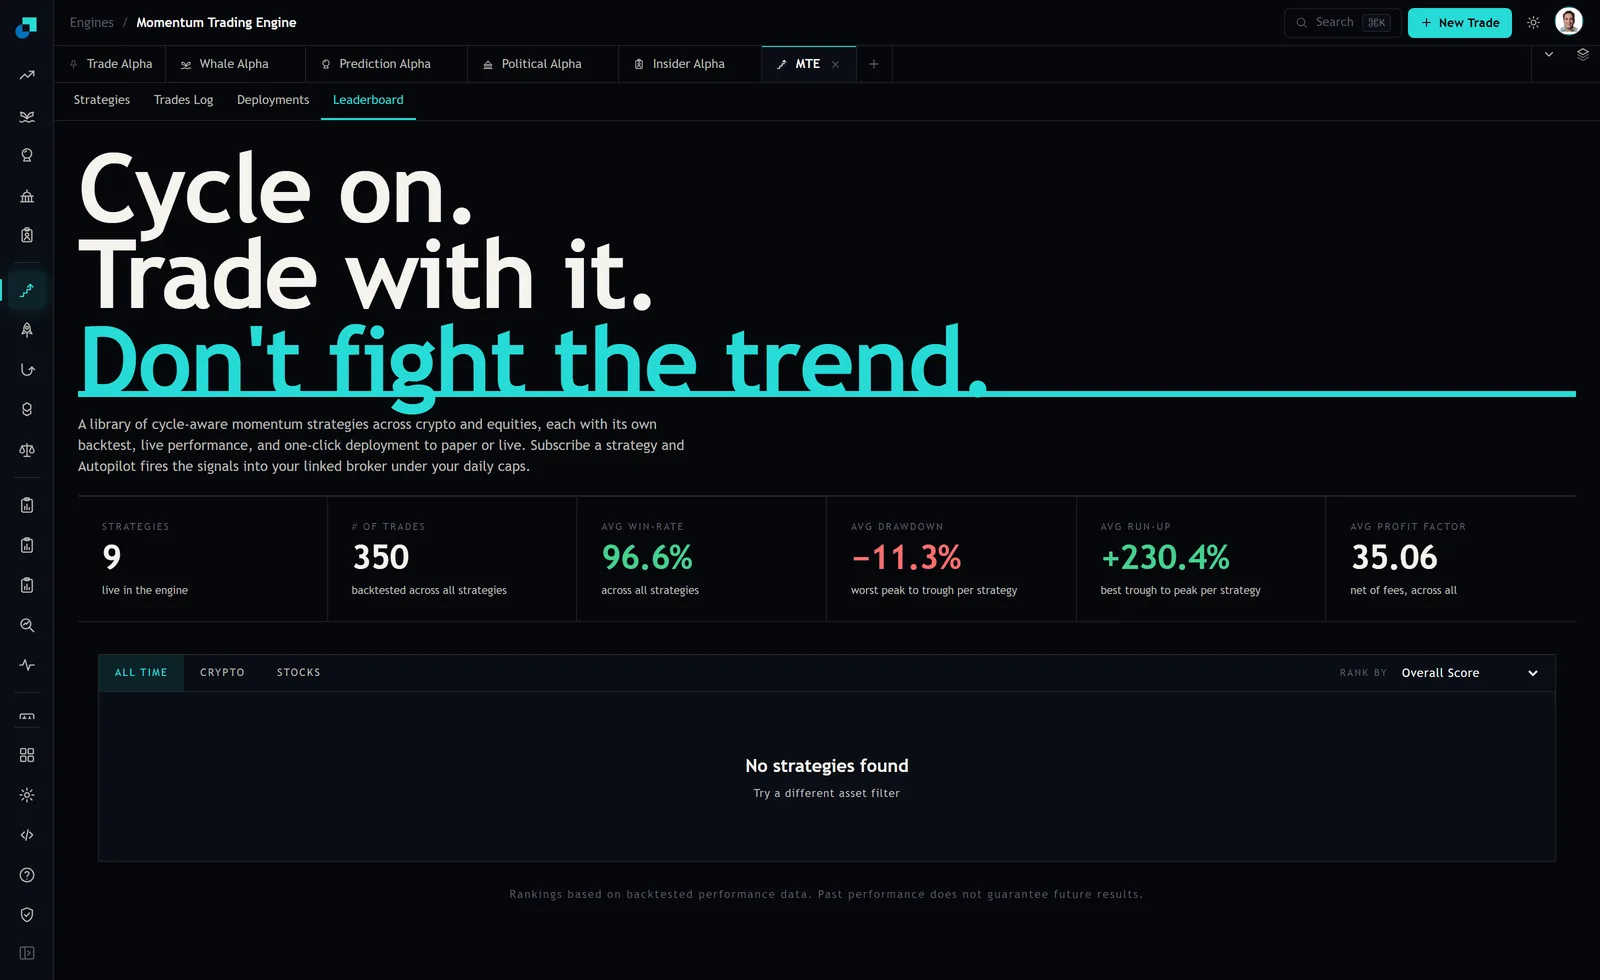
At capture the leaderboard tab was scoped by three filters, ALL TIME, CRYPTO and STOCKS, with a RANK BY control set to Overall Score. The panel body read "No strategies found" with the suggestion to try a different asset filter. Underneath sat the line that matters most for this discussion: rankings are based on backtested performance data, and past performance does not guarantee future results.
Read that carefully. A board populated from backtested performance is not a record of accounts. It is a record of simulations, ordered. The inclusion question for a composite is which portfolios are in it and from when. The inclusion question for this board is which simulations were run and which of those were published, and that second set is not observable from the outside.
Fee treatment, and what "net of fees" is net of
The engine's sixth header tile reports an average profit factor of 35.06 with the qualifier "net of fees, across all". That qualifier is doing a great deal of work and it is worth unpacking rather than accepting.
In a backtest, "net of fees" almost always means the commission and slippage assumptions configured inside the simulation. It does not mean a management fee, a performance fee, a platform subscription, financing on levered positions, borrow on shorts, or the tax drag on a high-turnover book. A composite has to state all of that, twice, because gross and net are separate columns and the fee schedule that produced the net figure has to be disclosed alongside it.
The second thing to establish is what the 35.06 is an average of. It is described as being across all strategies, of which there were nine live in the engine, against 350 backtested trades in total. That is roughly thirty-nine trades apiece. A profit factor computed on thirty-nine trades is dominated by whether the sample happened to contain a large loser. It is a real number and it is a short-sample number, and those two facts have to travel together in any memo that quotes it.
Dispersion, the figure a ranked list structurally cannot carry
This is the dimension where the gap is widest, and it is the one allocators care about most in practice. A composite reports, for each period, the dispersion of returns across the accounts inside it. High and low, or a standard deviation of account returns. That number answers the only question the prospective client actually has, which is whether they would have received the headline result or something quite different.
A leaderboard cannot report dispersion because a leaderboard is a list of point estimates. Sorting is the opposite operation to summarising spread. Worse, the tiles above the board present averages across strategies, which is a different quantity again from dispersion across accounts running the same strategy. Two deployments of one strategy, started three weeks apart with different fill quality, will not produce the same return, and nothing on this page has anywhere to put that fact.
The engine's own strategies table shows that the dispersion is not small. Three rows visible at capture reported win rates of 87.50%, 96.15% and 100.00%, with profit factors of 134.71, 13.39 and a blank. An average win rate tile of 96.6% is a faithful summary of that set and tells you nothing useful about any member of it.
Terminated deployments, and the ranking that has no column for them
The RANK BY control offered six orderings: Overall Score, Total Return, Risk-Adjusted Return, Win Rate, Alpha and Profit Factor. Every one of those is a property of something that is present. None of them is a way of surfacing something that used to be present and is not.
That asymmetry is the whole of survivorship. Composite rules exist because of it: a terminated portfolio stays in the composite through its last full measurement period, and it cannot be removed retroactively because it stopped looking good. A board has no equivalent obligation and no obvious place to discharge one. A deployment that is switched off simply stops rendering.
There is a second, smaller thing worth noting here for a diligence file. The module's own feature copy describes a public leaderboard ranking deployments by return, Sharpe, drawdown and win rate. The shipped RANK BY control offers no drawdown ordering. That is not a scandal, it is a documentation drift, but the point of an operational review is to catch exactly this class of discrepancy between what the marketing surface claims and what the product does, because the same drift can exist in places you cannot see.
The five things to ask for instead of the link
If you are on the buy side of this conversation, the leaderboard is a starting point for questions rather than an artefact you can file. Five requests, in the order I would make them.
- The written inclusion policy. Which deployments enter the record, from which date, and under what minimum period. If the answer is "the ones that are running", you have a survivor list.
- The count of configurations evaluated, not the count published. The engine's signal feeds label entries as version two configurations numbered into the twenties against nine live strategies. That gap is the denominator, and it is the input to any multiple-testing adjustment you want to apply.
- The full fee stack behind "net of fees", separated into simulated transaction costs and everything else. Ask specifically about financing and borrow, because a momentum book carries both.
- Per-period dispersion across deployments of the same strategy, however few there are. Two accounts is enough to start; the discipline matters more than the sample.
- The terminated list, with reason codes. Switched off by the owner, parameters changed, data feed lost, and closed manually are four different events, and only one of them is a performance judgement.
None of that is a criticism of a ranking tool for being a ranking tool. The board is clearly labelled as backtested and clearly warns that past performance does not guarantee future results. The failure mode is on the reading side, when a page that ranks simulations gets pasted into a memo under a heading that says track record. Those two words carry obligations the page never claimed to meet.