A generated market view starts life as a convenience and becomes house research at a specific, usually unrecorded moment: when somebody pastes it into an investment committee pack, quotes it in a client note, or forwards it to a portfolio manager who then acts on it. From that point the firm owns the claim, and the question of what the claim assumed is no longer academic.
The failure this produces is boring and predictable. Six weeks later a position is being reviewed, someone asks what the view was based on, and the answer is a screenshot. No input list, no vintage, no model version, no record of whether a human looked at it. The content was fine. The provenance was never captured, and provenance cannot be reconstructed after the fact.
Reading a card for what it does not tell you
The discipline starts with looking at a generated artifact and inventorying the absences rather than the content. Take the scorecard in the capture below as a worked example.
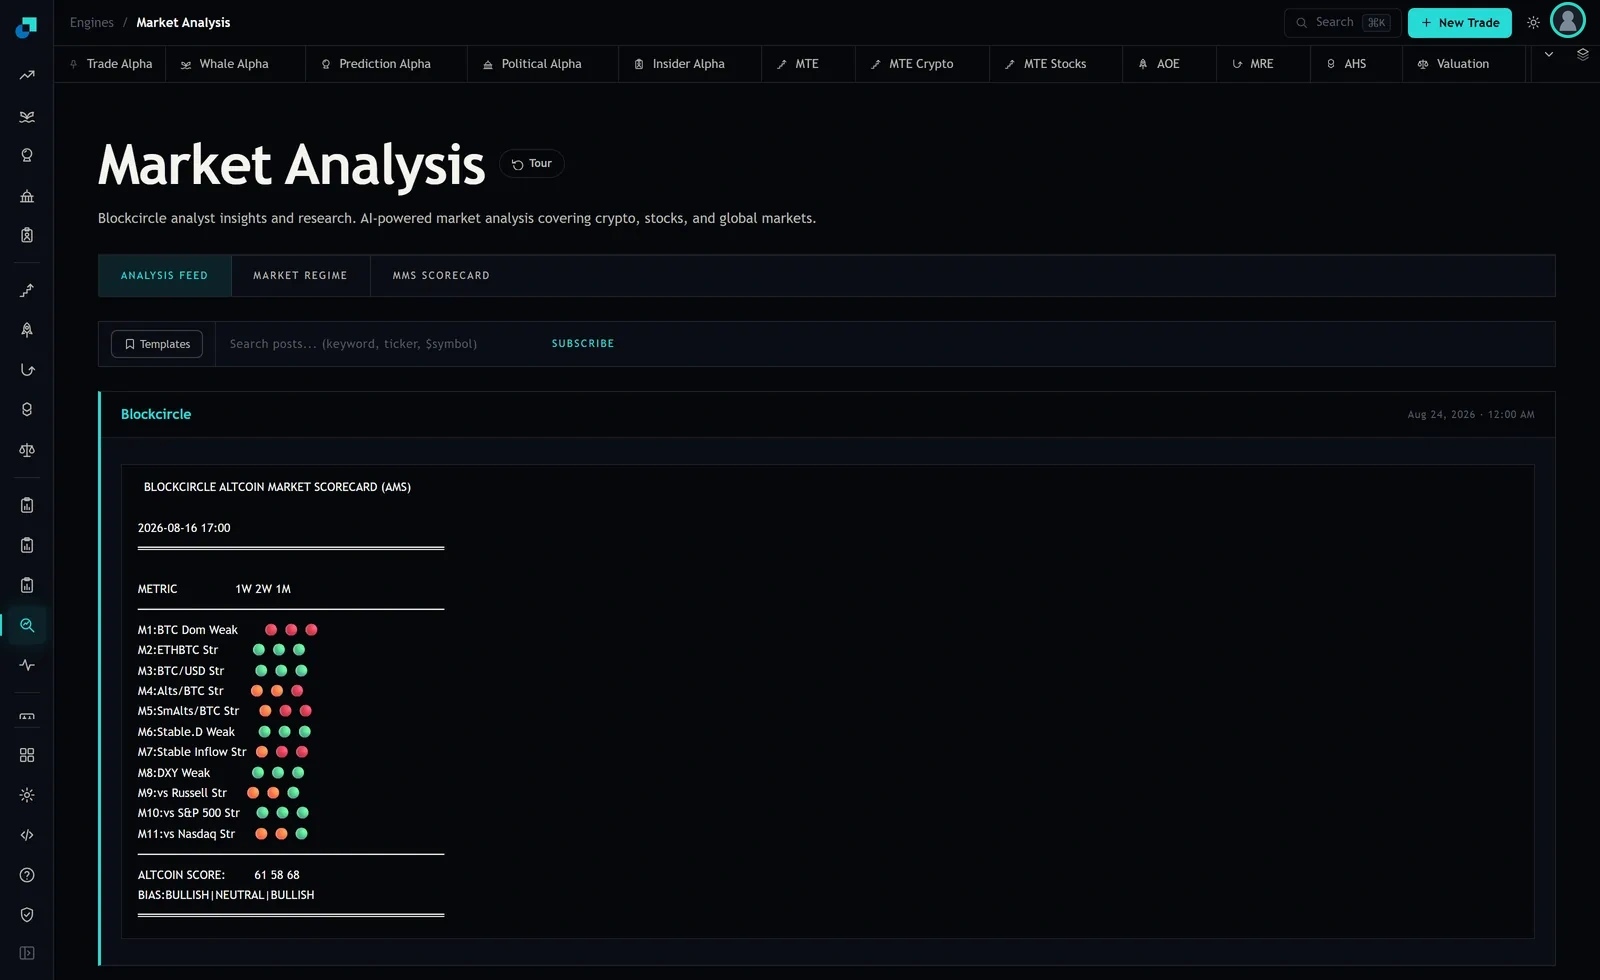
That is a well-formed artifact by the standards of most desks. It names its metrics rather than hiding them behind a single number, it prints three horizons instead of one, and it carries a data stamp at all, which puts it ahead of a large share of the commentary that circulates internally. The point is not that the card is deficient. The point is that a reader who forwards it is forwarding a composite whose construction is not on the page, and it is the forwarding firm, not the source, that has to be able to answer for it.
The two absences that matter most are the mapping and the vintage. The mapping is the set of rules converting each metric into red, amber or green, and converting eleven of those into 61. Without it, a reader cannot tell whether a green dot means a large move or a marginal one, and cannot tell how far a score of 61 sits from the boundary of its bias label. The vintage is worse, because the card has a second stamp in the feed header, Aug 24, 2026, eight days after the stamp inside the card. Two clocks on one artifact, and nothing on the page telling you which one the metrics were computed on.
The disclosure block, field by field
What follows is the minimum set that makes a generated view defensible. It is deliberately short, because a disclosure standard that runs to two pages does not get populated.
- Artifact identity and version. A stable identifier for this output and a version number that increments on every regeneration, so two people quoting the note can establish whether they are quoting the same one.
- Observation time, with timezone and precision. The moment the inputs were sampled, in UTC, flagged as date-precision where that is all the source provides.
- Generation time and publication time, kept as separate fields from observation time and never overwritten by it.
- Model or template identity and version, including the prompt or configuration version where the text is generated rather than formatted, plus any sampling parameters that affect output.
- Input inventory. Every source feeding the output, one line each, with that source's own vintage at run time.
- Coverage statement. The universe the view covers, what was excluded, and why.
- Threshold and mapping definitions, or a stable link to them. The rules that convert quantities into labels.
- Known limitations, written once and reused, covering what the method is not able to detect.
- Human review status. Reviewed, by whom, when, or explicitly not reviewed.
Nine fields, most of them machine-populated. The only ones needing a person are the coverage statement, the limitations text and the review status, and the first two change rarely enough to be maintained as standing text.
Vintage is a property of each input, not of the note
The single stamp on a generated note is the most misleading field on it, because a composite is exactly as current as its stalest component and the stamp usually reflects the run rather than the data.
Consider a scorecard with eleven rows. If nine of them are computed on prices from minutes ago, one on a daily series that updates at a fixed hour, and one on a source that publishes weekly, then the note is a week old in one dimension and current in nine. A reader seeing a single timestamp will assume the freshest case, and there is nothing on the page to correct them.
So report vintage as a distribution rather than a scalar. The two fields that carry almost all the value are the oldest input timestamp and the count of inputs older than a stated staleness threshold. A note whose oldest input is nine days old is a different object from one whose oldest input is nine minutes old, and those two notes currently look identical in every research library I have seen.
Add a hard rule alongside it: an input that exceeds its staleness threshold does not silently carry forward. It either fails the row, which the note must show, or it is marked as stale on the face of the output. Carrying yesterday's value into today's composite without saying so is the mechanism by which a live dashboard becomes a historical one without anyone noticing.
Coverage gaps and the difference between no signal and no data
Coverage is the disclosure most often skipped, and it produces the most confident wrong conclusions.
A metric computed over a universe is meaningful only with the universe attached. If a row is computed across a set of assets and a third of that set had insufficient history, the row is a statement about the surviving two thirds, and the direction of the resulting bias is usually knowable: the excluded names are typically the newest, the least liquid or the ones that stopped trading, all of which lean the same way.
The rendering problem sits on top of this. A row with no data and a row with a genuinely neutral reading can render as the same neutral colour or the same dash, and the reader cannot distinguish them. Any output that has an empty state needs a visually distinct one, and the disclosure block needs a count of rows in that state at generation time. Zero is a measurement. Missing is not, and a composite that treats missing as zero is understating its own uncertainty in a direction that flatters it.
The same applies to any historical series behind the note. If backfilled history was constructed differently from live data, that break belongs in the coverage statement, because every study run across it will inherit the discontinuity.
Making the block survive being copied
All of this is worthless if the disclosure stays on the source page while the content travels. Content gets screenshotted, pasted into chat, and quoted in decks, and it arrives at the decision stripped of everything except its conclusion.
Three mechanisms, in increasing order of effort and effectiveness. Put the artifact identifier and version in the visible body of the output itself, so it survives a screenshot. Keep an internal archive keyed on that identifier, holding the full disclosure block and the exact inputs, with a retention period long enough to cover your review cycle. And require that any internal document quoting a generated view cites the identifier, in the same way it would cite a broker note.
The test of whether this works is reproducibility. Take an identifier from four weeks ago, pull the archived inputs and the recorded model version, regenerate, and check that you get the same output. If you cannot, the disclosure is incomplete and the gap tells you exactly which field is missing. Run that test on a sample every quarter rather than waiting for someone external to run it for you, because the first time you attempt this reconstruction should not be during a review of a position that went wrong.