The overlay decision and the implementation decision get made by different people and reviewed in the same meeting, which is how a well-specified liquidity signal ends up being blamed for an execution choice. A composite turns, the policy says move net equity exposure by some number of points, and then somebody has to decide whether that happens in the futures book or by trading the sleeves. Those two routes have different cost profiles, different tax consequences, different tracking behaviour and very different reversal characteristics, and the right answer changes with the expected holding period of the shift.
The variable that decides this is holding period, not commission
Frame the comparison as fixed cost against carrying cost. A futures expression front-loads very little and then charges you continuously: financing embedded in the basis, roll at each expiry, margin funded from somewhere, and the operational cost of running the position. A cash sleeve expression front-loads the whole cost into the trade itself, in spread, market impact and any commission, and then charges you close to nothing to hold.
That means the two cost curves cross. Below some holding period the futures route is cheaper because you never pay the entry cost of moving real positions. Above it the cash route is cheaper because you stop paying to carry. Your job is to find where the crossover sits with your numbers, then check which side of it your overlay actually lives on.
The empirical input for that check is the distribution of your own signal durations, not an assumption. If the overlay historically holds a shift for two months and your crossover is at seven weeks, you are on the cash side more often than not and the futures habit is costing you. If the shift is routinely reversed inside three weeks, the reverse holds and trading sleeves is an expensive way to express a temporary view.
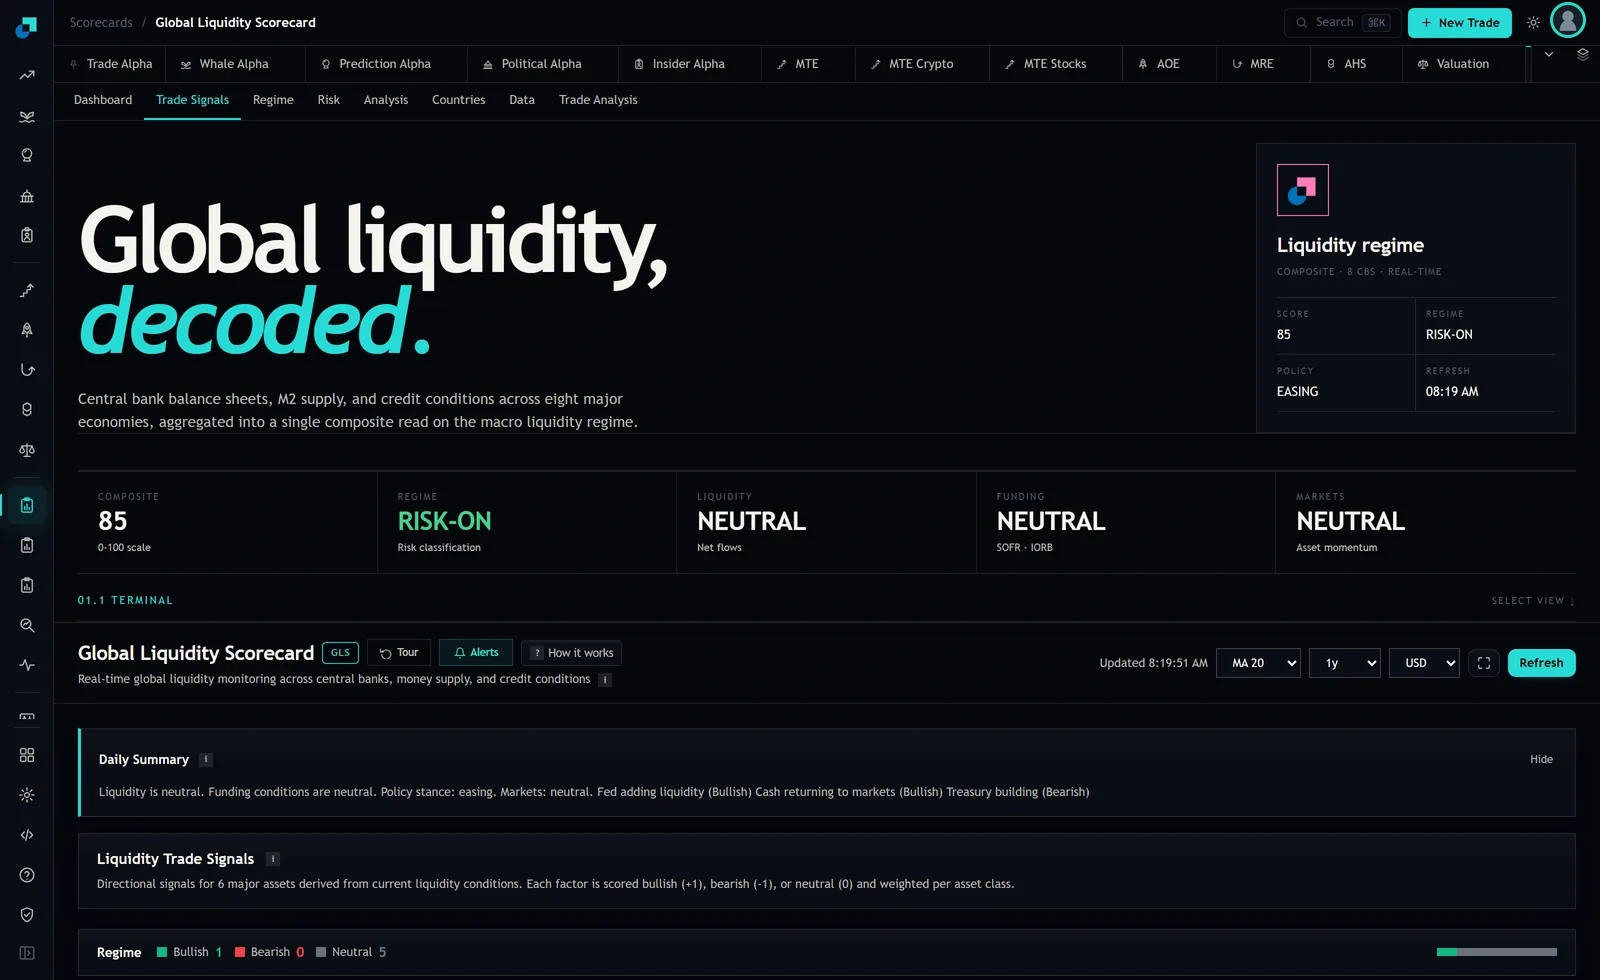
Read the capture with the implementation question in mind. A tally of one bullish against five neutral is a weak instruction, and weak instructions get reversed. Expressing a low-conviction, likely-short-lived shift by turning over real sleeves is the most common avoidable cost in an overlay programme.
The cost stack you have to fill in with your own numbers
I am not going to quote you basis point figures for specific contracts, because those move and a stale number in a policy document is worse than no number. Build the stack instead, and populate it from your own executed fills and your FCM's schedule.
| Cost line | Futures route | Cash sleeve route |
|---|---|---|
| Entry and exit | Spread on the contract plus clearing and execution fees, twice | Spread plus market impact on every underlying line, twice |
| Carry | Financing implied in the basis, accrued for the whole holding period | None beyond the securities you now hold |
| Roll | One spread crossing per expiry in the holding window | None |
| Collateral | Initial and variation margin, plus the opportunity cost of the cash posted | None, but the cash is fully committed |
| Operational | Daily mark, margin calls, expiry calendar management | Settlement and corporate actions on the lines traded |
Two lines in that table are routinely underestimated. Market impact on the cash route is not the quoted spread; for anything other than the most liquid names it is a function of your size against typical daily volume, and it is the number that scales badly as the programme grows. And the collateral line on the futures route is a real cost even when margin earns interest, because posted cash is not available for anything else and the variation margin call arrives on the worst day.
Tracking error and the part that shows up in the wrong quarter
A futures overlay does not give you the exposure you wanted. It gives you the exposure of the index the contract references, which differs from your book in composition, in weighting and in the specific factor tilts you were hired to run.
The consequence is that hedging or extending equity exposure through an index contract leaves a residual, and that residual is your active positioning against the index. In a period where your tilts work, an index overlay dilutes the outperformance. In a period where they do not, it flatters you. Either way the reported result contains a component that has nothing to do with the liquidity call, and attribution has to separate them or the overlay will be credited and debited for things it did not do.
Basis adds a second layer. The contract can trade away from fair value, particularly around quarter ends and around periods of funding stress, which is exactly when a liquidity overlay is most likely to be active. The cost of the expression is therefore correlated with the signal that triggered it. That is not a reason to avoid futures, but it belongs in the policy as a stated risk rather than as a surprise in the quarterly numbers.
Quantify the residual before you need it. Run the intended overlay notionally against your actual book over your available history and report the tracking difference distribution. If the interquartile range of that difference is comparable to the size of the exposure shift you are trying to make, the overlay is not implementing your view, it is adding a second uncorrelated bet.
Tax, and the sleeve you cannot cheaply un-sell
For a taxable pool this usually settles the argument on its own. Trading sleeves to reduce exposure realises gains on positions selected for their size rather than their tax profile, and the tax is due whether or not the liquidity call turns out to be right. A derivative expression leaves the underlying holdings intact and moves the exposure around them.
Derivative expressions carry their own tax treatment, which varies by instrument and jurisdiction and needs to come from your own advisers rather than from a blog. The general shape that matters for the decision is that the cash route converts an exposure decision into an irreversible realisation event, while the derivative route generally does not. For a signal that can reverse inside a quarter, that asymmetry dominates most of the cost lines in the table above.
For a tax-exempt pool this whole section drops out, which is why the same overlay is implemented differently across two mandates at the same firm without either desk being wrong.
Speed of reversal, which is the line item nobody prices
The last dimension is the one that should carry the most weight for a liquidity overlay specifically, because these signals whipsaw.
Ask how long it takes to get back to the prior book. On the futures route the answer is close to immediate for liquid contracts, and the cost of the round trip is roughly what you already paid to put it on. On the cash route the answer depends on the liquidity of the least liquid line you touched, and the round trip costs you the entry cost again plus whatever the market has done to your impact profile in the interim.
Then combine that with the honest expected reversal rate of the signal. If a meaningful share of exposure shifts are reversed within a month, the expected implementation cost of the cash route has to be multiplied by that turnover, and the comparison usually stops being close. This is the argument for running the overlay in derivatives even when a single-trip cost comparison favours the sleeves.
Where the shift is large, expected to persist, and in a taxable pool with no derivative infrastructure, trade the sleeves and accept the cost. Where it is small, low conviction, and likely to reverse, which is what the screen above describes, use the futures book or do not make the shift at all. Those two sentences are the entire policy, and they belong in the overlay document next to the trigger, not in the head of whoever happens to be covering the desk.