I went looking for a specific number and I want to tell you up front that I did not find it. The question is a good one: when the Global Liquidity Scorecard shows a regime label, how long has that state typically lasted before flipping? Knowing that changes how you size, because a state with a long typical life should be traded as an environment, and a state with a short one should be traded as a wobble. Those are opposite behaviours and the difference between them is a base rate.
The number I wanted and could not get
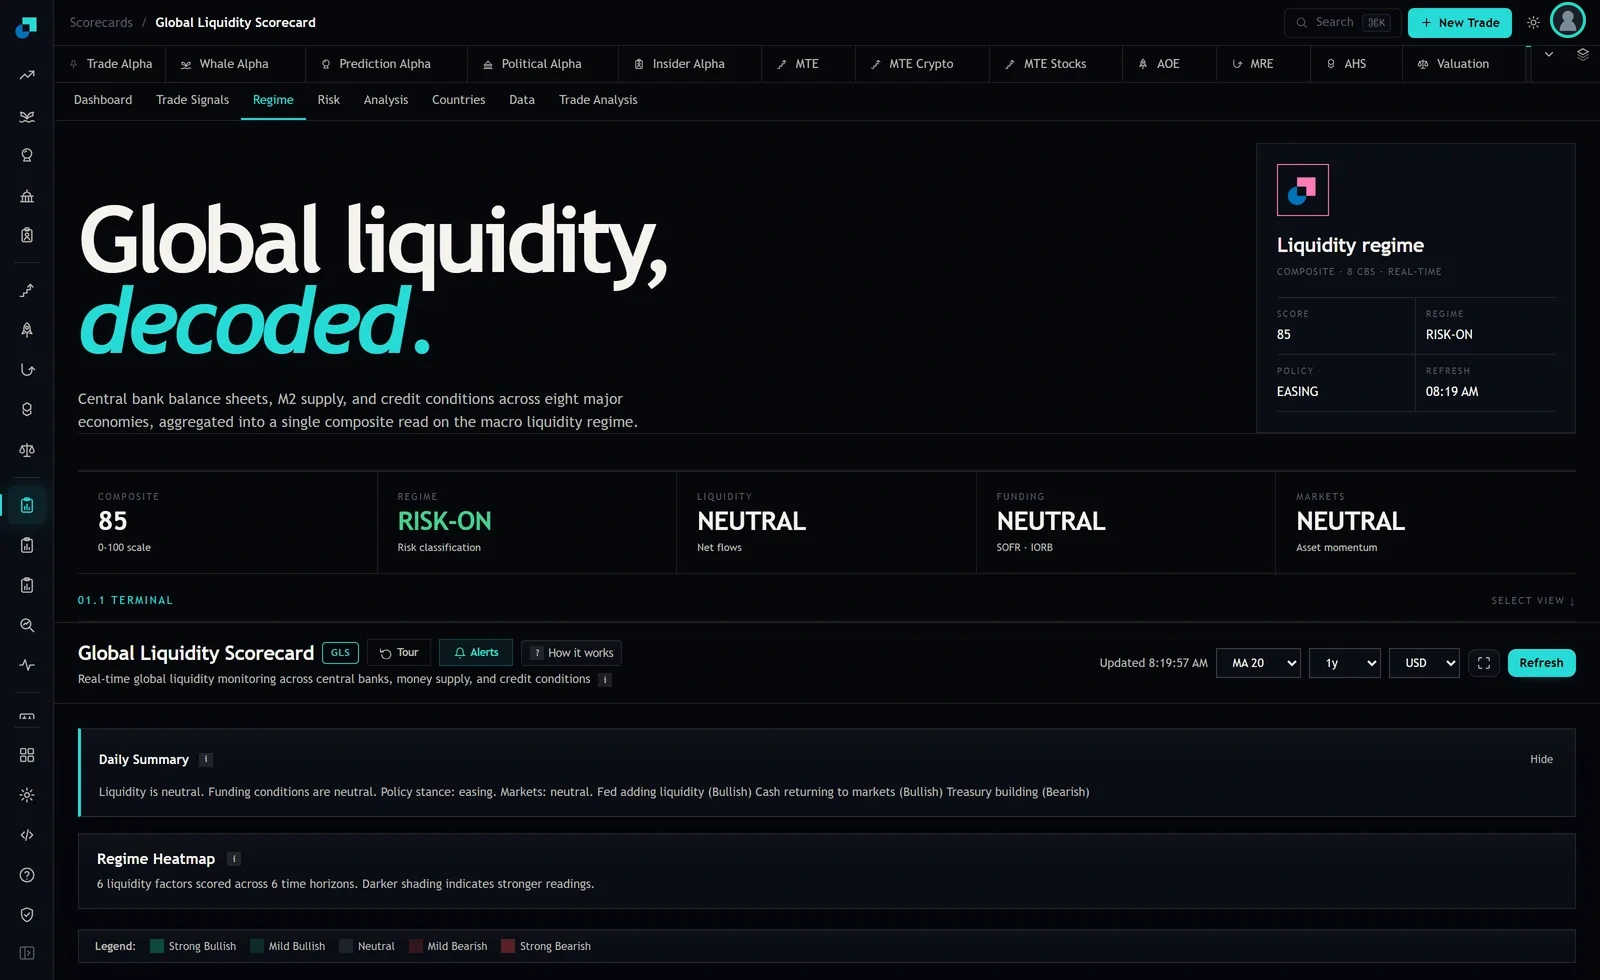
Here is what the Regime tab actually shows. A strip across the top reading COMPOSITE 85 on a 0 to 100 scale, REGIME RISK-ON with a sub-label of "Risk classification", then LIQUIDITY NEUTRAL on net flows, FUNDING NEUTRAL on the SOFR and IORB relationship, and MARKETS NEUTRAL on asset momentum. Below that a Daily Summary in sentences, and a Regime Heatmap panel scoring six liquidity factors across six time horizons on a five-level scale from strong bullish to strong bearish.
All of that describes the present. None of it is a duration table. There is no field telling you how many days this state has been in force, and no panel giving the historical distribution of state lengths. The module has a chart window selector in its header, currently set to 1y, which is a view control on the series rather than a published statistic about how long regimes last.
So I am not going to give you an average. I could construct a plausible-sounding one, write "regimes have typically run four to seven months", and it would read well and be completely invented. That is the single worst thing an article like this can do, because you would size a position against it. What I can give you is the reason the question matters more than it feels like it should, and the method for producing the answer yourself, which takes about ninety seconds a week.
Why the duration question changes your position size
Consider two worlds with the same regime label on screen today.
In the first, states typically persist for many months. The correct behaviour is to treat a regime read as a description of the environment, adjust your allocation once, and then largely ignore the dashboard. The cost of being early is low because you have time. Trading every twitch is pure cost.
In the second, states typically last a few weeks. Now the label is much closer to noise. By the time you have observed a flip, decided, placed an order and been filled, a meaningful fraction of the typical state length has already elapsed. In that world the correct response to a regime change is usually to do nothing, because the signal decays faster than you can act on it after costs.
Same screen, opposite conclusions. And the failure mode I see most often is people behaving as though they live in the second world, reacting to every flip, while telling themselves they live in the first. A base rate is what settles that argument, and until you have one you are guessing about which market you are in.
Building the base rate yourself, one line a week
This is genuinely a spreadsheet exercise and it costs nothing but patience.
Open the Regime tab at the same time on the same day each week. Write one row: date, composite, regime label, policy label, the three component reads, and the refresh stamp shown in the header. That is it. Do not go back and reconstruct history from the chart, because the underlying central bank and monetary data get revised, and a reconstructed history shows a past that nobody actually traded.
Once you have rows, the duration calculation is trivial. Every time the regime label differs from the previous row, close out the previous spell and record its length in weeks. After a year you will have a handful of spells. After three years you will have something you can genuinely reason about.
Two refinements worth adding from the start, because retrofitting them is annoying.
- Record the composite alongside the label, not just the label. A state that persists while the composite drifts steadily toward a boundary is a different animal from one that persists while the composite sits mid-range, and you will only see that if you kept the number.
- Record whether the heatmap looked coherent across horizons or split. A regime that is agreed across the six time horizons is intuitively more likely to persist than one where the short horizons disagree with the long ones. Log it and you can eventually check that intuition instead of assuming it.
The two ways your own base rate will still mislead you
Even a carefully kept log has limits, and you should know them before you lean on the output.
The first is sample size. Three years of weekly readings is about 156 rows, but if the label only changed five times in that period, your base rate rests on five spells. Five observations produce an average and essentially no information about the spread. The honest statement from that sample is "the shortest I have seen is X weeks and the longest is Y weeks", which is a range, not a forecast. Resist the urge to average five numbers and quote the result to one decimal place.
The second is that spells are censored at both ends of your sample. The state you are in right now has not finished, so its length is unknown and it does not belong in your average as though it had ended. The state that was already running when you started logging began before you looked, so its true length is longer than what you recorded. Both of those biases pull in the same direction, which is toward understating how long regimes last. If you are going to be wrong, at least know which way.
What to do while your sample is too small to trust
You do not get to wait three years before acting, so here is the interim rule I would use, built to be robust to not knowing the base rate.
Require persistence before you act. Rather than adjusting on the first week a label changes, require the new label to hold for a set number of consecutive weekly readings before it moves your allocation. Two or three is reasonable. If regimes are long, you give up a small fraction of the state and lose almost nothing. If regimes are short, this rule filters out most of the flips you would have traded and paid for. It performs acceptably in both worlds, which is exactly what you want from a rule built under uncertainty about which world you are in.
Then cap what the regime is allowed to move. Keep a core allocation the dashboard cannot touch, and an overlay sleeve of perhaps a quarter of the account that the regime read is allowed to swing between fully invested and cash. That cap is not modesty. It is the thing that keeps a wrong regime call from producing a drawdown large enough that you abandon the process, which is how these frameworks actually fail.
And keep logging. In eighteen months the base rate question stops being unanswerable for you specifically, on your own data, which is a better position than anyone quoting an average they cannot source.