Someone on the desk says launch quality has deteriorated. Everyone nods, because it feels true, and because the last four things anyone looked at went to zero. Then a month later somebody else says the opposite with equal confidence. Neither statement is checkable, because neither is attached to a cohort, an observation window, or a definition of the thing being counted.
Vintage cohorting is the standard fix and it is borrowed from credit and from venture, where the same problem shows up as loan books and fund years. You group by origination period, you measure every group at the same age rather than on the same calendar date, and you apply one mechanical survival rule to all of them. Do that and you can say something defensible about whether this quarter is structurally worse. Skip it and you have a mood.
Why the live ledger cannot answer this on its own
Start with what the module actually presents, because it sets the boundary of what is measurable without your own capture infrastructure. The launches ledger covers nine chains, all nine active on my capture, with Solana and the EVM chains behind the chips. The header reads 100 of 3,771 displayed. Sort is newest, market cap or volume. The filters above the table set a minimum market cap, minimum volume and minimum holders, and templates persist a filter set.
Every one of those is a present-tense control. They interrogate the state of the universe now. A vintage question is not a present-tense question, it is a question about a population defined at a past moment and observed forward, and no arrangement of sort and filter on a live feed produces that. The Date column gives you an origination stamp, which is the one input you genuinely need, but the fields beside it are current values rather than values as they stood at origination.
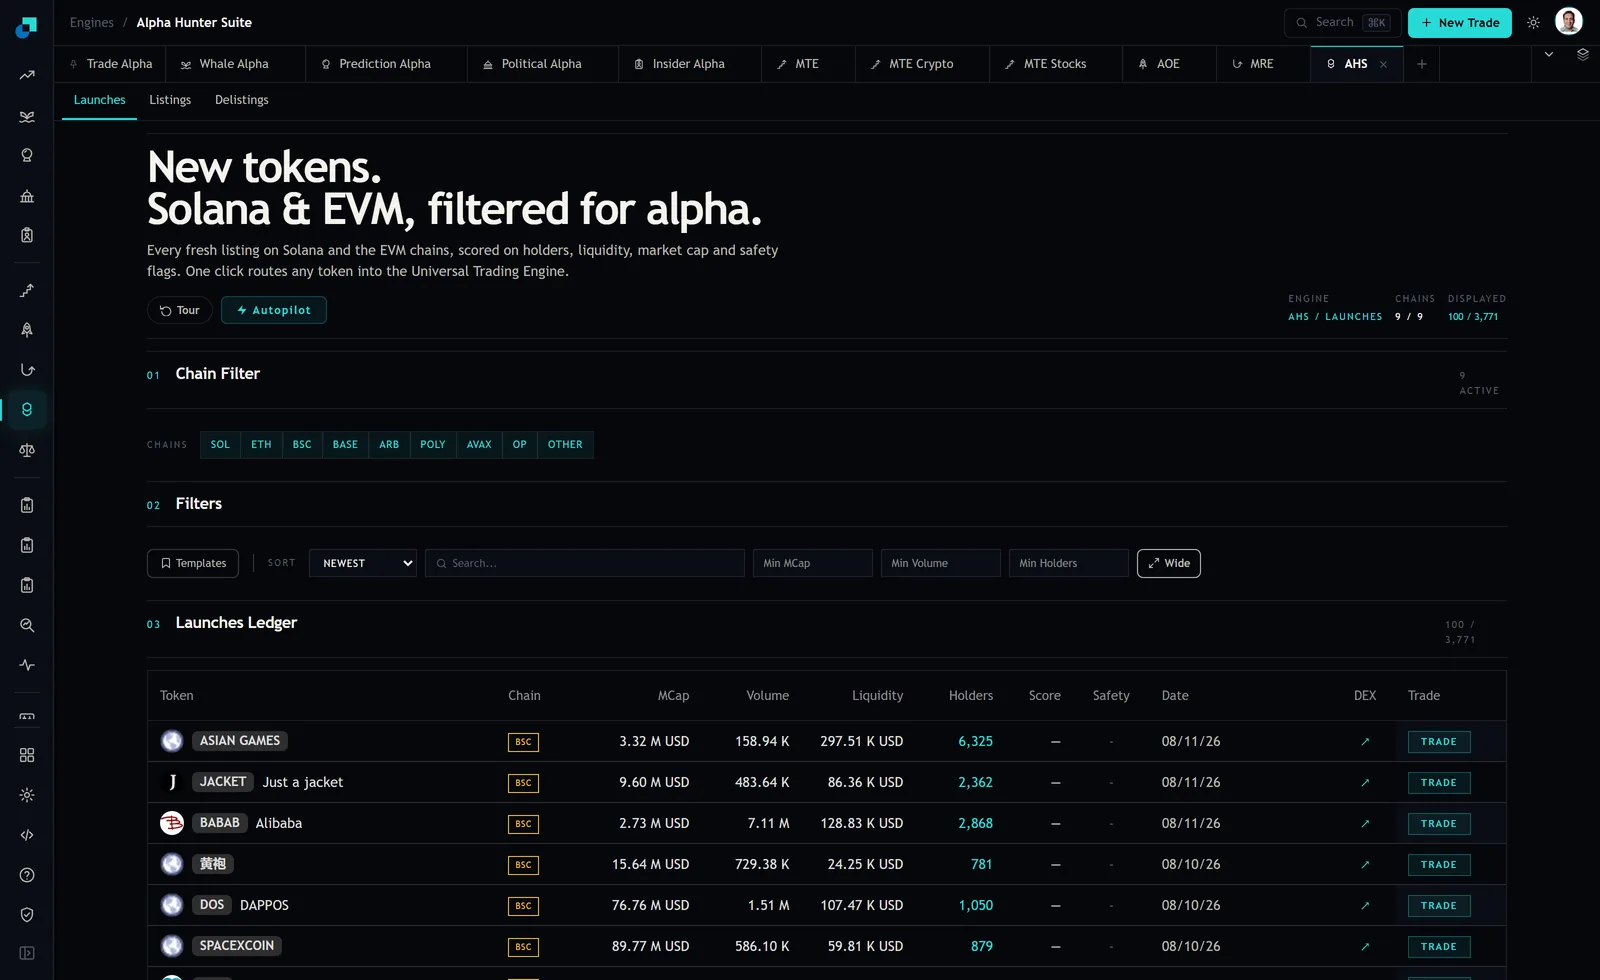
There is a precondition worth resolving before you spend a week on this. If the ledger does not retain rows for tokens that have gone to zero liquidity, then a cohort you build retrospectively from the feed contains only survivors, and every survival rate you compute comes out at or near one hundred percent by construction. I would not assume either way. Test it directly by pulling rows for a date at least ninety days back and checking whether any of them carry zero or near-zero liquidity. If nothing dead appears, your cohorts have to be built from your own daily snapshots going forward, and the study starts the day you start capturing, not the day you decide to run it.
Fixing the vintage, and the clock you measure against
A vintage is the set of launches whose Date field falls in one calendar month. Monthly is the right granularity for this universe. Weekly cohorts are too noisy to compare and quarterly ones hide the regime shifts you are trying to detect.
Two rules make the cohort mean something. First, membership is frozen at first observation. A token enters the July vintage on the day you first see it and never leaves, regardless of what happens to it. Second, every measurement is age-aligned, not calendar-aligned. You compare the July cohort at thirty days to the March cohort at thirty days. Comparing both on today's date compares a one-month-old population against a five-month-old one and reports the age difference as a quality difference.
The measurement points worth carrying are day 7, day 30 and day 90. Seven days is where launch mania resolves. Thirty is where a project either has a market or does not. Ninety is where you find out whether anything durable exists. Past ninety days the population is small enough that the cohort stops being informative and you are reading noise.
Record, at each point, the fields the row already carries. Liquidity, holders, volume, market cap, chain. Store the value as observed, keyed by token address and observation date. Address, not symbol. Symbols repeat across contracts and chains and a symbol-keyed table will silently merge unrelated tokens.
A survival rule that is mechanical, and a depth rule that is honest
Survival has to be defined before you look at any results, written down, and applied identically to every cohort. Otherwise the threshold drifts toward whatever produces the conclusion the desk already reached.
A workable definition uses the fields on the row rather than any judgement about the project. A token is alive at age t if liquidity is above a stated floor, holders are above a stated floor, and volume over the trailing window is non-zero. The floors are a policy choice you defend rather than a fact you discover, and the sensible way to set them is by reference to your own minimum viable position. If the smallest position the book would ever take is fifty thousand dollars, a token sitting on twenty-five thousand dollars of pool depth is dead for your purposes whether or not it is dead in some abstract sense. Publish the floors alongside the results and re-run at two alternative floors to show the conclusion is not an artefact of one threshold.
Survival rates on their own overstate health, because a token can satisfy every floor while having lost almost all of its depth. Carry a second series alongside it. Depth retention is liquidity at age t divided by liquidity at first observation, reported as the cohort median. Use the median, never the mean. These distributions have a small number of enormous survivors and a mean will let two of them carry a cohort of hundreds.
The confounds that will invalidate the comparison
Chain mix is the big one, and the capture in the screenshot shows exactly why. Every visible row on it is a BSC launch. If one vintage is overwhelmingly one chain and another is spread across Solana and the EVM chains, a difference in survival between them may be reporting where launch activity migrated rather than whether launches got worse. The fix is to stratify. Compute survival within chain, then compare like against like, and report the cohort-level number as a mix-adjusted figure holding chain weights constant at some reference vintage. If the raw and adjusted numbers diverge, the divergence is the finding.
Coverage drift is the second. If chain support was added or a data source changed partway through your sample, the vintages either side of that change are not comparable and the break will present itself convincingly as a regime shift. Keep a change log of the capture pipeline and mark every vintage that spans a change. This is unglamorous and it is the thing that saves the study when someone senior asks why the line moves in March.
The third is the display cap. One hundred rows out of 3,771 is not a sample, it is a top slice under whatever sort is active, and sorting by market cap or volume selects precisely the launches most likely to survive. If your capture is a top-100 pull, say so in the write-up and treat every survival number as an upper bound on the full population. If you need the population, the capture has to page or filter down deliberately rather than skim.
What the finished table lets you claim in a review
The deliverable is one table, one row per vintage, and it should be readable by someone who was not involved.
| Column | Definition |
|---|---|
| Vintage | Calendar month of the Date field on the launch row |
| N | Count at first observation, frozen |
| Chain mix | Share of N by chain, at first observation |
| Alive d30, d90 | Share of N meeting all three survival floors at that age |
| Median depth retention | Cohort median of liquidity at age t over liquidity at entry |
| Mix-adjusted alive d90 | Survival reweighted to reference-vintage chain weights |
What that table supports is a bounded claim. You can say the September vintage had a lower ninety-day survival rate than the March vintage under a stated liquidity floor, that the gap narrows or widens after adjusting for chain mix, and that the result holds across three floor settings. That is a sentence you can put in a memo and defend when someone pushes on it eight months later.
What it does not support is a forward statement. A deteriorating survival series is a description of cohorts that have already completed their observation window. Treating it as a prediction about the vintage currently originating is exactly the error the cohort method exists to prevent, and it is the error that will be made in the meeting if you present the table without the age-alignment slide in front of it.