There are two doors through which a regime model can enter a portfolio, and choosing the wrong one is the reason most macro overlays end up quietly switched off eighteen months after they are approved.
The first door is strategy selection. The model tells you what to own, which sleeves to run, which sign to take. The second is the risk budget. The model tells you how much gross to carry while the strategy mix stays exactly where the investment committee put it. The second door is narrower, less exciting, and enormously easier to defend.
Why the directional door fails a review
Route a regime label into strategy selection and you have coupled the entire book to one classifier. Every position now depends on the label being right, and the failure mode is fully correlated. That is a real risk and it is not the worst part.
The worst part is attribution. Once the overlay chooses which strategies run, you can no longer separate what your managers or models earned from what the overlay chose. Performance in a good quarter has two possible parents and no test distinguishes them. The first time somebody asks whether the overlay is adding value, the honest answer is that the data cannot say, and an overlay whose value cannot be measured does not survive its second bad year.
Route it into the risk budget instead and the picture is completely different. The strategy mix is held fixed, so every underlying return series remains what it was. The overlay contributes exactly one time series, the gross multiplier, and its contribution to performance is a single arithmetic line. That property is worth more than any expected improvement in the model.
Confidence sets the size, the label sets the sign
The mapping has to answer two questions and it is important that different things answer them.
The label answers direction. Define a small integer for each regime, positive for labels whose implied posture is toward risk assets, negative for defensive ones, zero for the neutral bucket. That mapping is written once, approved once, and never revisited mid-quarter. Confidence answers magnitude only. A high confidence figure on a defensive label must reduce gross, not raise it, and any mapping that scales gross on confidence alone gets this exactly backwards in precisely the environment where it matters.
So the multiplier takes the form of one plus the direction integer, times a slope, times the transformed confidence. Bound the result. My default bounds are a floor around 0.6 and a cap around 1.2 of policy gross, which gives the overlay a total range of less than two to one.
The floor is not a detail. A mapping that can reach zero has handed a classifier the authority to take the fund flat, and no regime model has earned that. The cap matters for the same reason in reverse. If the overlay can authorise leverage beyond policy, then policy gross is no longer the constraint and your risk limits now live inside a model that was never approved as a risk limit.
Do not treat 75 percent as 0.75
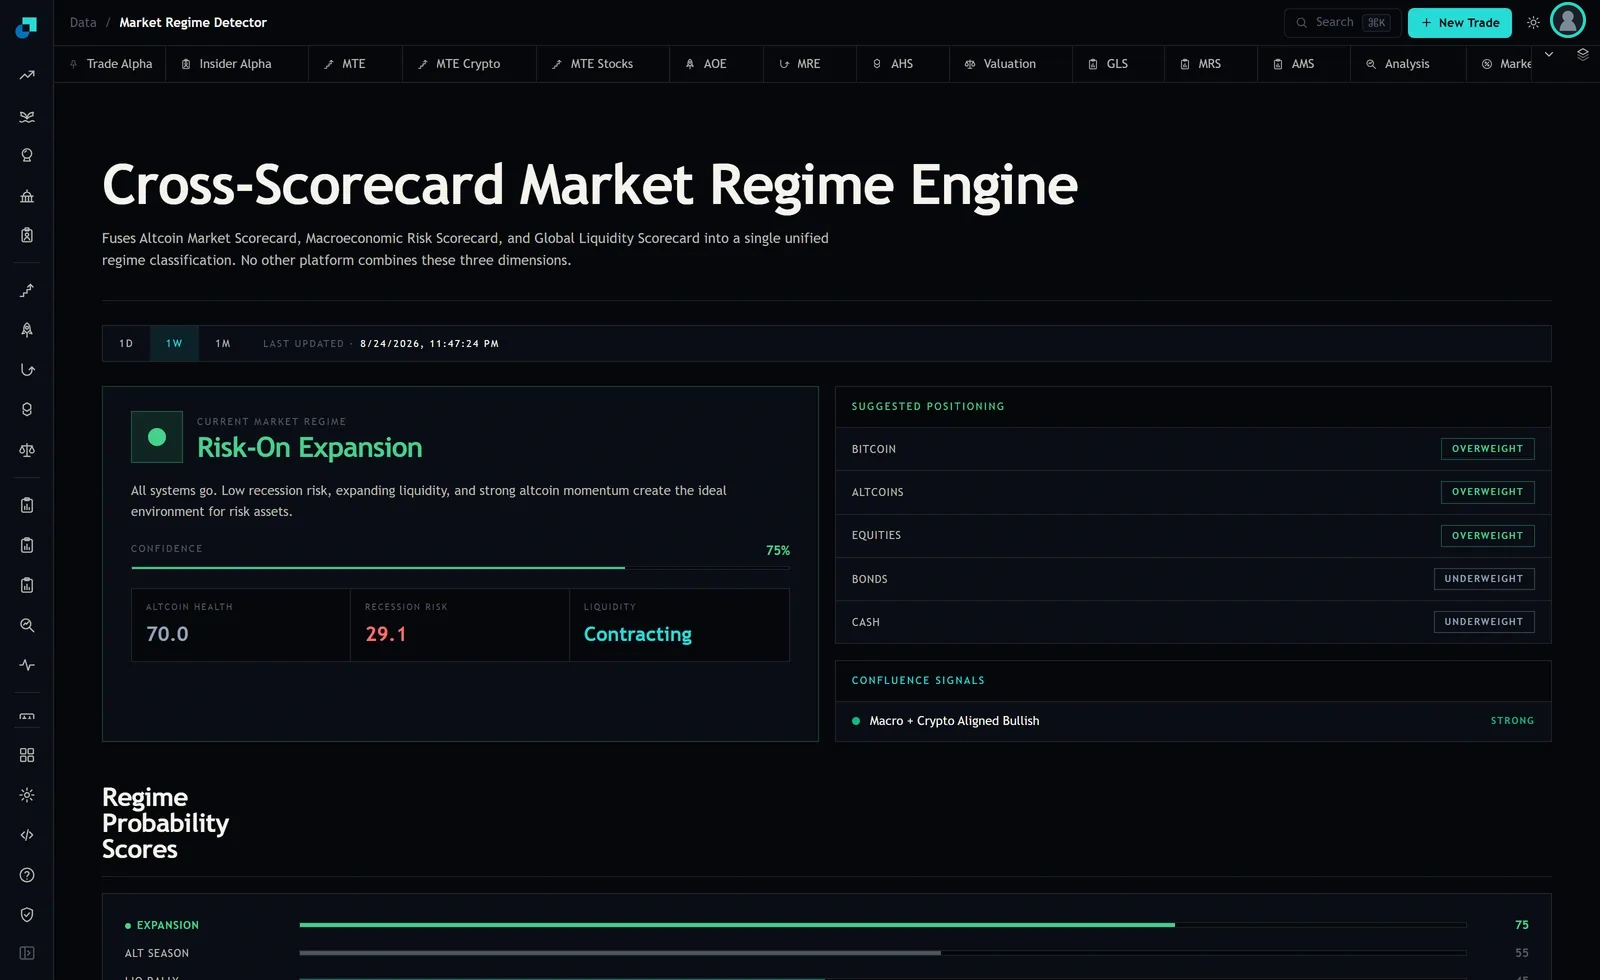
The card in this capture read 75 percent confidence under a Risk-On Expansion label. The temptation is to feed 0.75 into a formula as though it were a probability. It almost certainly is not one.
The engine fuses three scorecards, and a confidence figure produced by that construction is measuring agreement between inputs. Agreement is computable the moment the inputs arrive and never touches an outcome, so it cannot be a statement about historical success rates unless somebody separately calibrated it. There is a further hint in the same capture. The confidence figure and the top probability score bar both read 75, which suggests the confidence value may simply be the winning regime's own score rather than an independent quantity.
The robust fix is to stop using the raw level and use its percentile instead. Keep a snapshot archive, compute the empirical distribution of confidence readings on your chosen timeframe, and map today's reading to its percentile within that history. Scale on the percentile. This is invariant to the unknown scale of the underlying figure, it handles the case where the number never goes below 40 in practice, and it means you are comparing today's agreement to typical agreement rather than to an arbitrary midpoint.
One more hardening step is worth the effort. Rather than consuming the published confidence at all, recompute a simple agreement measure yourself from the component readings the card exposes, altcoin health, recession risk and liquidity direction. The capture is a good argument for doing this, since its description text claimed expanding liquidity while its own tile read Contracting. A derived field you compute from visible components cannot drift away from them.
Deadbands, turnover and the cost of breathing
Gross scaling is the cheapest way to express a macro view because it moves every position proportionally rather than rotating between them. That does not make it free.
Add a deadband. Only reweight when the target multiplier differs from the implemented one by more than a stated amount, and set that amount from your own cost per unit of gross turnover rather than from a round number. Without it, a percentile transform on a noisy confidence figure will generate a small trade every single update, and the aggregate of those trades will exceed anything the overlay earns.
Consider also whether the timeframe control does the work for you. The screen offers 1D, 1W and 1M readings, and reading the monthly figure is a smoothing decision you get for free. Measure the multiplier's own turnover on each of the three before adding machinery to smooth the fastest one.
Two limits sit above all of this and neither runs through the overlay. Realised portfolio risk limits, and a manual de-risking authority with a named owner. The regime overlay decides how much of your policy risk budget you use. It does not get to decide what the budget is, and it does not get a vote on whether risk can be cut in a crisis.
The attribution line the committee will ask for
Because the strategy mix is fixed, the overlay's contribution is exact rather than estimated. In each period, the base portfolio earned some return at policy gross. The implemented portfolio earned that return times the multiplier. The overlay's contribution is the sum over periods of the multiplier minus one, times the base return, minus the turnover costs the multiplier caused.
Report that number every quarter next to the base portfolio return, and report the multiplier's own statistics beside it. Mean, range, how many periods it spent at the floor and at the cap, and the number of reweights. A multiplier that has spent most of its life pinned at the cap is not an overlay, it is a leverage increase with a story attached, and you would rather find that out from your own report than from somebody else's question.
Fix the mapping in a document before the first live period, with the direction integers, the slope, the floor, the cap and the deadband all written out. If it is later changed, keep the old mapping in the record and show the performance under both. Overlays are not usually abandoned because they failed. They are abandoned because nobody could reconstruct what they were supposed to be doing.