Here is the complaint, and I have had some version of it myself. The market rips fifteen percent in two days, you open the scorecard expecting the composite to have jumped, and it has gone from 61 to 63. The following week the market gives it all back and the score barely notices that either. It feels like the panel is asleep. It is not asleep. It is measuring things that genuinely do not move as fast as a price does, and once you see which things, the slowness stops being annoying and starts being the reason to look at it at all.
Eleven metrics, and most of them are not prices
The module names its inputs, which is more than most composites do. The eleven are BTC Dominance, USDT Dominance, Altcoin Volume Ratio, Funding Rates, Open Interest, Stablecoin Flows, Exchange Reserves, Large Transaction Volume, NVT Ratio, MVRV Z-Score, and Realized Cap Changes. Go through them and sort them by how fast they can physically change.
Funding rates and open interest are the fast ones. They are derivatives positioning and they can turn inside a session. The two dominance ratios and the volume ratio move with price, though as ratios they move less than the price of any single token does, because both the numerator and the denominator are moving.
Then there is the rest, and this is where the slowness comes from. Exchange reserves are a stock, the amount of coin sitting on venues, and a stock changes only as fast as coins are actually moved. Stablecoin flows are a flow measured over a window. Realized cap changes accumulate as coins move at new prices, which is a slow grind by construction. NVT and MVRV are valuation ratios whose denominators are network activity and realized cost basis, neither of which reprices because a chart went vertical on Tuesday.
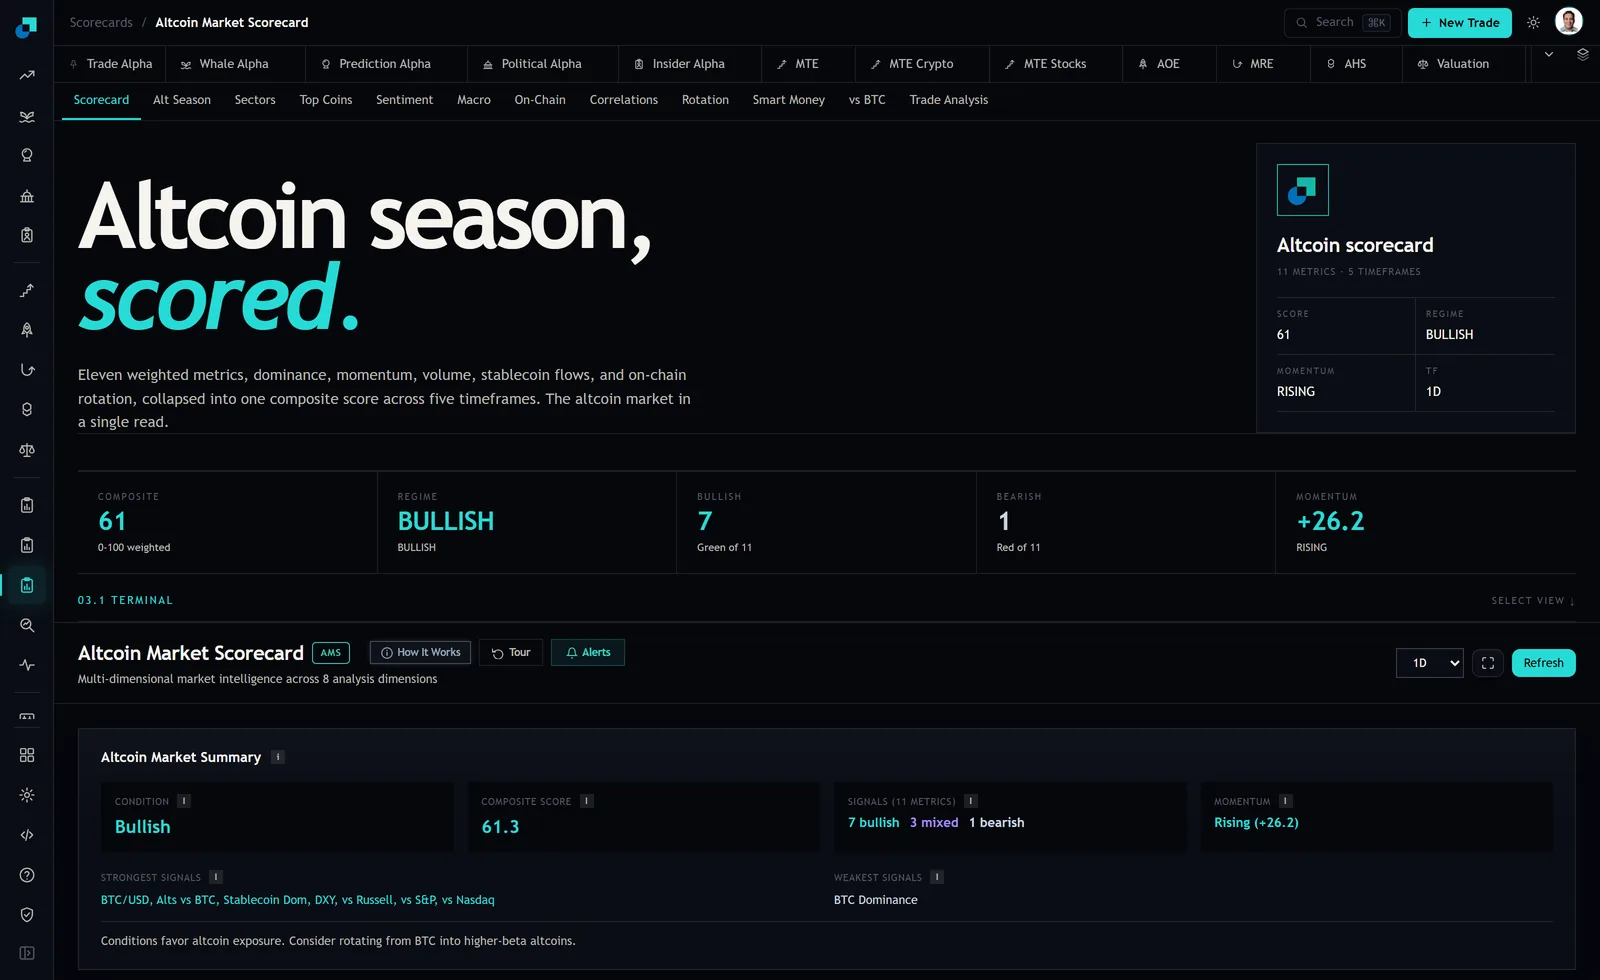
So roughly a third of the blend can respond to a two-day move and the rest cannot. A composite where seven of eleven inputs are structurally sluggish is going to be structurally sluggish. That is arithmetic, not a setting someone forgot to turn up.
What averaging does to a step change
I do not know the exact lookback window behind each input, and I am not going to pretend to. What I can show you is the general shape, because the arithmetic of averaging is the same everywhere and it explains most of what you observe on the panel.
Take any measure that is reported as an average of the last thirty days. Something happens today that changes the underlying reality completely, a permanent step up. Tomorrow that average contains one new day and twenty-nine old ones, so it has moved about one thirtieth of the way, a bit over three percent of the distance. After three days it has covered ten percent. After a week, roughly a quarter. It takes the full thirty days to arrive.
Now put that inside a weighted blend where the input in question is one of eleven. If that metric is worth roughly nine percent of the composite and it swings hard, the composite moves by a fraction of a point on day one. Stack a few inputs moving in the same direction and you get the couple of points you actually observed. A market that moved fifteen percent and a score that moved two points are consistent with each other, and if you were expecting the score to track the price you were expecting it to be a price chart, which you already have.
The five timeframes exist so you can stop refreshing the shortest one
The header carries a timeframe field, and the reading in the screenshot was taken on 1D. There are five available. The useful discipline for a small account is to pick one, write it down, and read only that one. Not the most favourable, not a different one each week. One.
If you find yourself reloading the 1D view several times a day, you have chosen the shortest available lens and then applied it at a frequency it was never built for. The composite is not recalculating your position for you between refreshes, and the extra looks add nothing except opportunities to feel something. A weekly read on a fixed timeframe gives you almost all of the information a daily read gives you, because the underlying inputs mostly cannot change materially in a day.
The arithmetic of checking it too often
This is where the cost is, and it is a real cost with a number on it rather than a lecture about patience.
Every look is an invitation to act. Suppose you check daily, and that leads you to adjust your holdings twice a month, moving about thirty percent of a 5,000 dollar account each time. That is 1,500 dollars turned over per adjustment, so 3,000 dollars out and back in per adjustment when you count both legs. At a realistic all-in cost of 0.20 percent per leg once you include the spread you actually cross rather than the headline fee, each adjustment costs about 6 dollars. Twenty-four adjustments a year is roughly 144 dollars, which is about 2.9 percent of the account, paid annually, for the privilege of reacting to a number that was designed not to change quickly.
Nearly three percent a year is not a rounding error on a small account. It is the difference between a decent year and a flat one, and unlike market outcomes it is entirely under your control. A weekly cadence with a cap of one change per session cuts that bill by most of its size, and it does so without giving up any information, because there is very little information in the difference between Tuesday's reading and Wednesday's.
When a fast move in the composite is telling you something real
The flip side of a slow blend is that when it does move quickly, the move is worth attention, and knowing this is the payoff for understanding the construction.
A one-point change is noise. Given eleven inputs, a single metric drifting inside its normal range can produce a point in either direction, and if you find yourself reading meaning into 61 versus 62 you are reading meaning into rounding. But a move of several points in a single day cannot come from one input, because no single input carries enough weight. It requires several of them to have moved in the same direction at once, which means the fast derivatives measures and at least some of the slow flow measures agreed. That is a genuinely different event from a price move, and it is the one reading that justifies breaking your cadence and looking at the module off schedule.
The other one is the regime and momentum labels in the header, which read BULLISH and RISING at capture. Those are summaries of the same underlying blend, so they change less often than the composite does, and a change in either is by construction a bigger event than a few points of drift in the number beside them.