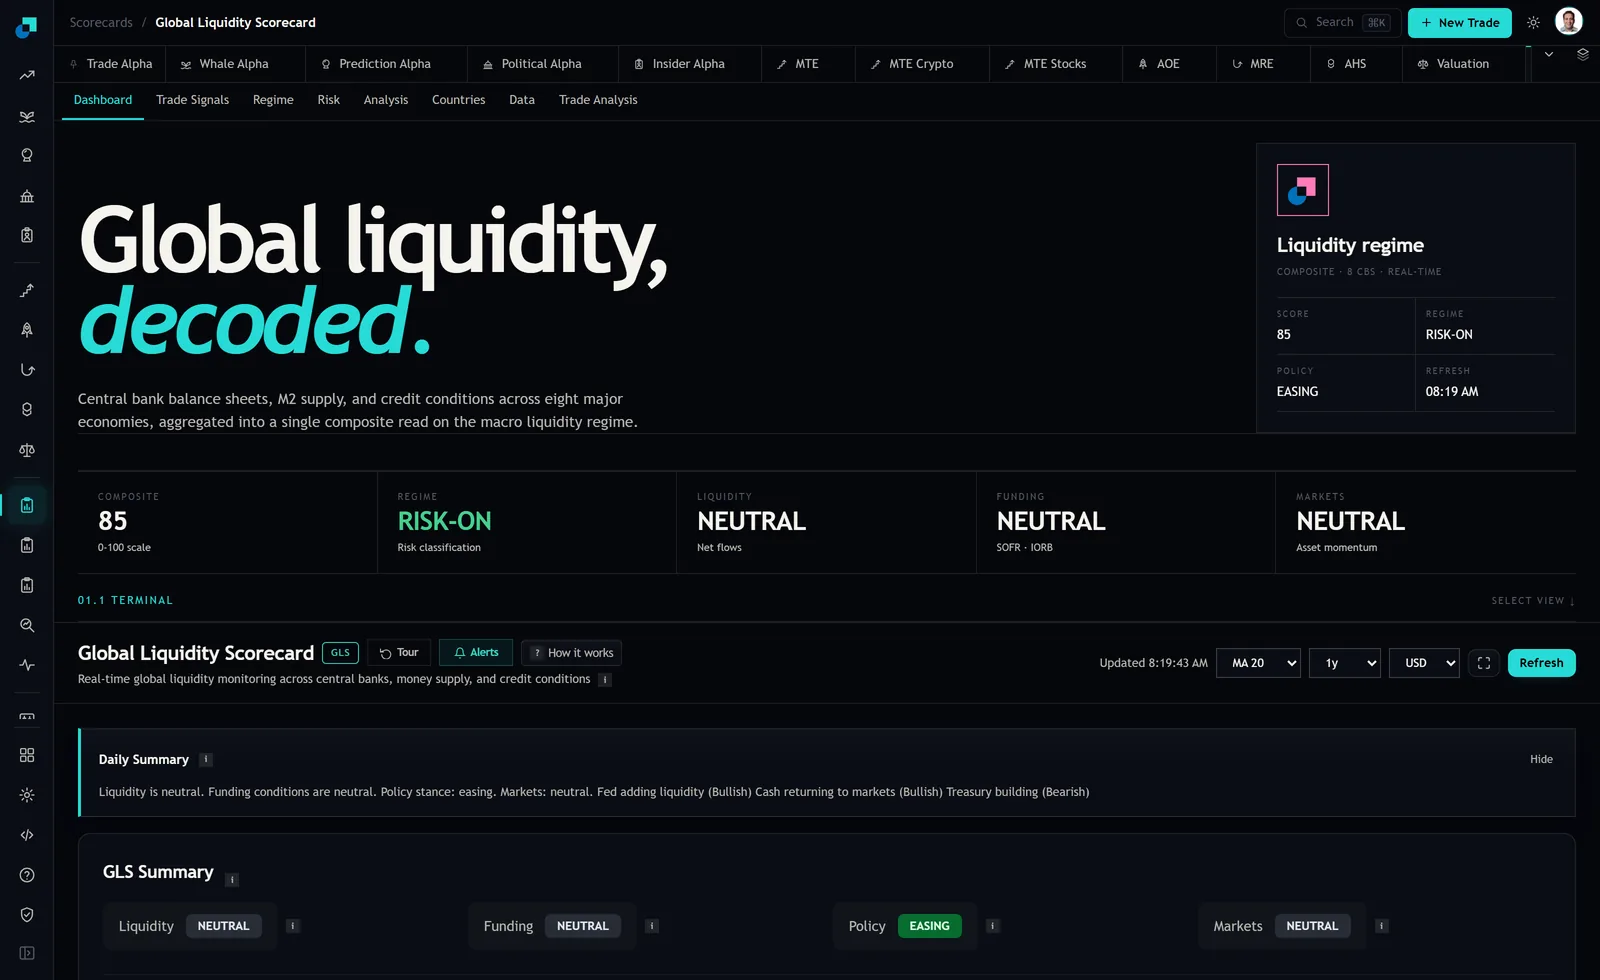
The Global Liquidity Scorecard names five input families: the aggregate central bank balance sheet, global M2 money supply, USD liquidity indicators, credit spreads and the composite built on them. Four of those five are slow. Balance sheets publish on institutional calendars, weekly at best. Money supply describes a month that has already closed. Only the market priced legs move today, and among them the overnight secured funding market moves first, because it has to clear every single afternoon whether anyone likes the price or not.
That is the whole case for watching the spread between the secured overnight financing rate and the interest paid on reserve balances as the leading edge of a liquidity read. It is not a better measure of liquidity than the balance sheet. It is a much faster one, and in a composite where everything else is on a weekly or monthly clock, speed is the scarce quantity.
What the spread is actually pricing
Two rates, two very different mechanisms. The reserve balance rate is administered. It is set by the central bank and it is what a bank earns for leaving cash on deposit rather than lending it. The secured overnight rate is a market outcome, the rate at which cash is actually lent against Treasury collateral overnight.
In an ample reserve system those two should sit close together, because a bank with spare cash faces a simple comparison: lend it in repo, or leave it at the central bank. When repo pays less, cash goes to the central bank. When repo pays more, cash goes to repo, and the arbitrage should pull the two back into line.
So the interesting state is the one where it does not pull back. When the secured rate prints persistently above the administered rate and stays there, something is preventing that arbitrage from clearing. Usually it is that the cash is not where the demand is, or that balance sheet capacity to intermediate has run out, or that collateral supply has swamped the cash available to fund it. All three are the same thing from a portfolio perspective: at the margin, funding has got harder, and it got harder today rather than in a statistic you will read next month.
Why it leads, mechanically rather than empirically
I want to be careful about the claim being made here, because the strong version of it is not one I can support and it gets asserted far too casually.
The weak version is mechanical and is simply true. A daily series can turn on any day. A weekly series can only turn on its publication day, and a monthly series only on its. If a common underlying condition is deteriorating, the daily series will register it first with probability approaching one, purely because it has more opportunities to register anything. That is arithmetic, not forecasting.
The strong version, that a widening overnight spread reliably predicts a subsequent contraction in the slower aggregates by some specific number of days, is a claim that would need testing on your own data before you put it in a document. I would not repeat it as received wisdom, and I would be suspicious of anyone who quotes a precise lead time without showing you the sample.
What the weak version buys you is still substantial. It gives you a monitoring line that changes state before your primary composite can, which means it functions as a reason to look harder rather than as a signal to trade. That is the correct job for it.
Thresholds that survive a regime change
The most common way desks get this wrong is by fixing a threshold in basis points and inheriting it from an earlier operating framework. The administered rate structure has been changed more than once, the corridor has been reshaped, and standing facilities have been added. A fixed absolute threshold carried across one of those changes is measuring a different thing than the person who set it intended.
Build the threshold from your own trailing distribution instead.
- Compute the daily spread and keep a rolling window of it. A year of business days is a reasonable base, long enough to contain a full seasonal cycle and short enough not to span a framework change.
- Define the alert level as a percentile of that trailing window rather than a level. The 95th percentile of the last year is a defensible starting point and, more importantly, it is a definition that stays meaningful when the whole distribution shifts.
- Require persistence. A single session above the line is noise. Three consecutive sessions is a condition. Whatever number you choose, choose it in advance and record it, because the temptation to extend it by one more day while a position is on is very strong.
- Flag the calendar rather than filtering it. Quarter ends and year ends distort overnight funding for reasons that are about balance sheet reporting and not about liquidity, and so do heavy settlement dates. Do not silently exclude them, because a genuine stress that happens to land on a quarter end is exactly the one you cannot afford to suppress. Mark them and require a second look.
- Re-estimate the percentile bands on a fixed schedule, quarterly, and never in response to a breach.
Where it sits in the monitoring ladder
The structure I would run has three rungs, ordered by speed, and each rung has a defined consequence so that nobody has to improvise under pressure.
The daily rung is the overnight spread. Its consequence is escalation only. A sustained breach means the funding condition gets raised at the morning meeting and a note goes in the log. Nothing is sold on rung one. If your process allows a daily funding print to move the book by itself, you have built something that will be whipsawed by quarter end mechanics several times a year.
The weekly rung is the balance sheet leg. Its consequence is a review of the composite reading in light of the funding flag. This is where a RISK-ON regime label sitting on top of a deteriorating funding print becomes a documented disagreement rather than an uncomfortable feeling, and it is where the decision to reduce gross gets made if it is going to be made.
The monthly rung is money supply and the slow aggregates. Its consequence is confirmation or retraction. By the time this rung moves, the position decision is weeks old and the only thing left is to record whether the early flag was right, which is the input that lets you calibrate the percentile band next quarter instead of arguing about it.
One thing to be clear eyed about when you present this internally. The overnight spread is public, it is watched by every funding desk in the market, and there is no informational edge in it. Nobody should be told it is proprietary insight. What it is, is a cheap and unusually honest instrument for the specific job of knowing that your slow composite is about to be stale in a direction that matters, which is a risk management function and should be budgeted and justified as one.