I want to be blunt about what this screen is before describing how to use it. It requires two conditions: heavy short interest and insider buying. The first condition is a filter for companies that a lot of people with capital at risk have bet against. The second is a filter that a great many perfectly ordinary companies satisfy every month. Combine them and the population you get is dominated by businesses in trouble where somebody on the inside bought some stock. Occasionally that is the setup of the year. Usually it is a falling knife with a press release attached.
The screen selects for trouble by construction, not by accident
Start with what short interest above twenty percent of float actually represents. Somebody borrowed those shares, paid a fee to borrow them, sold them, and is now paying that fee every day while carrying unlimited theoretical loss. That is an expensive, effortful, ongoing bet. It is not a mood. People do not do it casually and they do not do it in bulk to companies that are performing well.
So the first thing the screen has told you, before any insider appears, is that a well capitalised group with a research budget has concluded something is wrong and has been willing to pay to hold that view. You may end up disagreeing with them, and sometimes they are wrong in expensive and public ways. But the base rate for the group of names that satisfies this condition is not the base rate for the market. Any honest use of the screen begins by accepting that you are fishing in a pond that has been stocked with problems.
The insider side does less work than people assume. Officers and directors at every company buy shares from time to time, for reasons that include genuine conviction, a desire to be seen supporting the stock, board ownership requirements, and habit. In a company under pressure, the incentive to make a visible purchase is stronger than usual, and the purchase that gets made is often small relative to the person's wealth. A visible gesture and a conviction bet look identical in a table with a dollar column.
What the screen shows and where it stops
The Squeeze view describes itself as tickers where insiders are buying while short interest is elevated, pairing insider transactions with the bi monthly short interest report. At capture the controls were a minimum short percentage offering 5, 10, 15, 20 and 30 percent, a lookback of 7, 30, 60 or 90 days, an insider direction set to Buys, and a minimum trade value of Any, 25 thousand, 100 thousand, 500 thousand or one million dollars. The results table carried Ticker, Company, Insider, Filed, Trade value, SI percent of float, DTC and Signal.
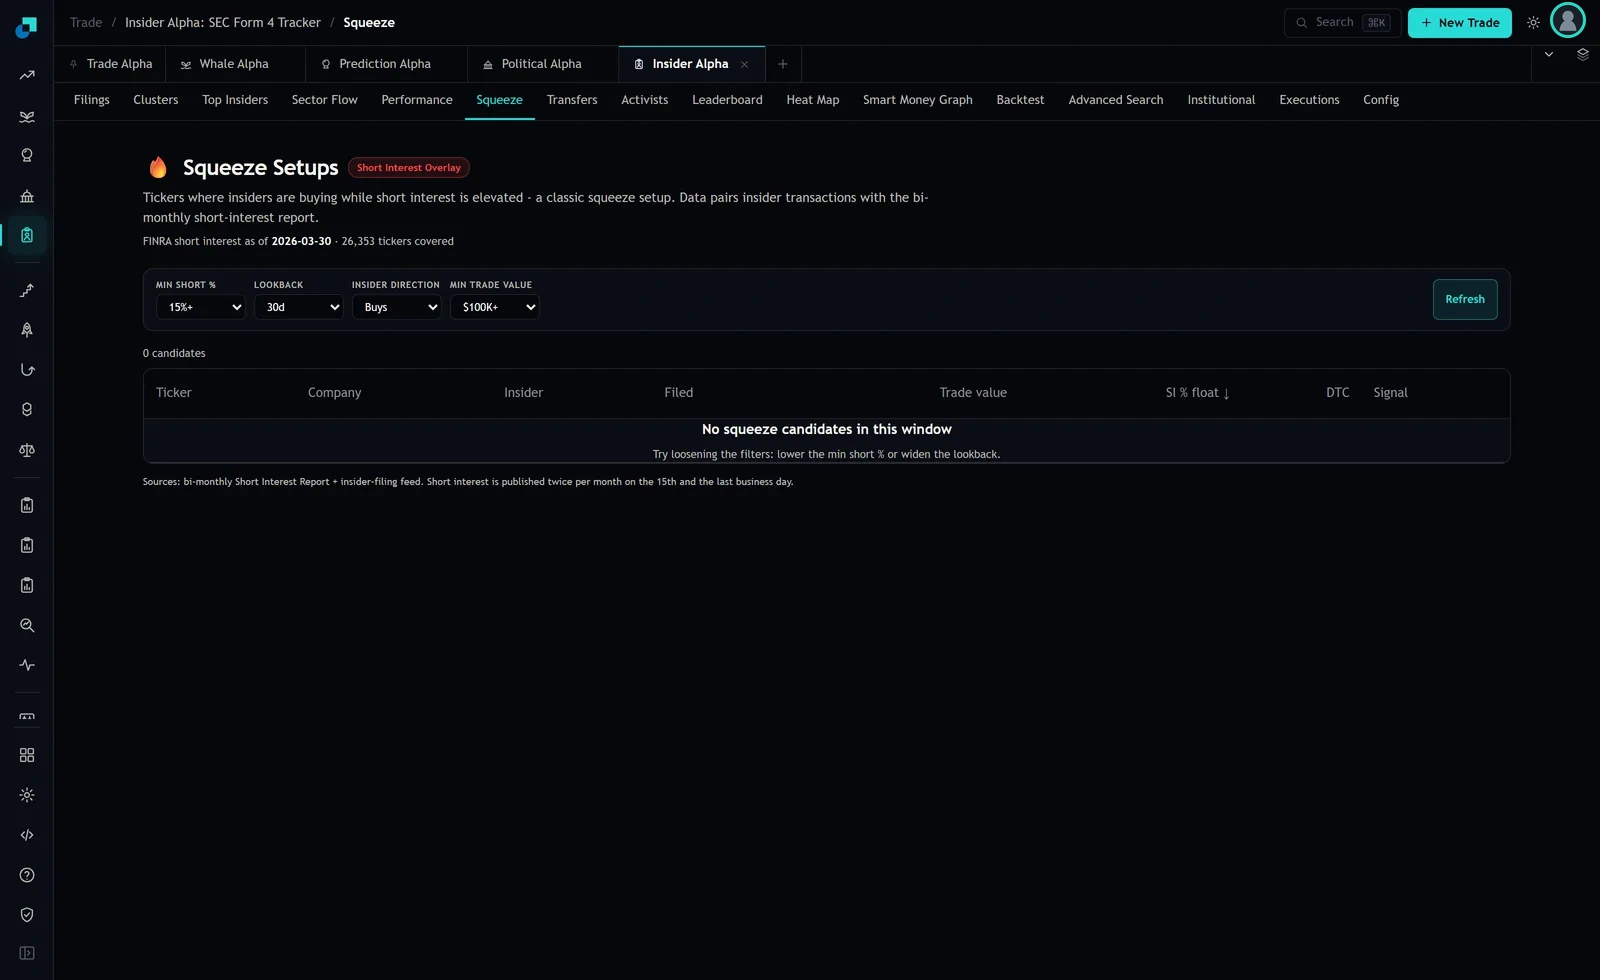
Notice what is not there. No revenue, no cash position, no debt, no going concern flag, no price chart. Nothing on this screen distinguishes a shorted company with two years of cash and a fixable problem from a shorted company that will be raising equity at a discount next quarter. The screen is a join between two data feeds and it is honest about being that. The business judgment is entirely yours and there is no field on the page that will do any part of it for you.
Filter one, make the purchase large enough to have hurt
The minimum trade value dropdown is the most useful control on the screen and most people leave it too low. A twenty five thousand dollar purchase by a chief executive is not a meaningful commitment of personal capital, it is a rounding error against their compensation, and it produces exactly the headline the company wants.
Set it to 500 thousand dollars, or a million if the list is long. You will get far fewer rows and that is the point. What you are trying to buy with this filter is the small population of purchases where the person would genuinely feel it if they were wrong. It is a crude proxy for conviction and it is the best one available in a dollar column.
Then do the check the screen cannot do. Open the filing and look at whether this person has bought before, and at what prices. Somebody buying for the third time on the way down is telling you something quite different from somebody buying for the first time in five years, and the two things are not both bullish. Serial buying into a decline is a pattern that ends well sometimes and ends with an equity raise at other times.
Filter two, separate the person from the sponsor
The module's coverage description lists officer, director and ten percent owner transactions, and those three are not the same signal. A ten percent owner is frequently a fund, a family office or a sponsor with an existing large stake, and their purchases can be portfolio management, an averaging down policy, or a contractual arrangement rather than a fresh view on value.
The screen has an Insider column but I could not find a role filter on it, so this step happens in the filing itself, which lists the reporting person's relationship to the issuer. It takes under a minute. If the buyer is an entity rather than a named officer, treat the row as one notch weaker, not because sponsors are wrong but because their reasons are structural and yours would be informational.
The purchase you want is by an operating officer with direct visibility into current trading. In a shorted company that visibility is the whole edge, because the entire argument between the bulls and the bears is about facts that will be public in one or two quarters and that a chief financial officer already knows.
Filter three, check the date on the short data before you believe the setup
This is the filter nobody applies and it invalidates more rows than the other two combined. Under the title, the page states the vintage of the short leg. At capture it read FINRA short interest as of 2026-03-30, with 26,353 tickers covered, and the footer explains that short interest is published twice per month, on the fifteenth and the last business day.
So the SI percent of float in front of you is a fortnightly snapshot with a reporting lag, and the insider filing beside it can be considerably more recent. If your lookback is set to 90 days, you may be looking at a purchase that happened after the short interest was measured, in which case the crowding figure describes a market that no longer exists. Shorts may have covered, or the short base may have doubled. You do not know, and the row does not tell you.
The fix is to keep the lookback tight, at 7 or 30 days, and to check the screen shortly after each publication date rather than at random. Aligning your review with the data cadence costs nothing and removes the worst mismatches automatically.
The empty screen is the correct outcome and the trap that follows it
With 15 percent, 30 days, Buys and 100 thousand dollars set, the screen showed zero candidates and displayed a message saying there were no squeeze candidates in this window, suggesting you lower the minimum short percentage or widen the lookback.
That is a helpful interface and a terrible instruction. Loosening the filters until the list is not empty is the mechanism by which a rare setup becomes a common one and gets traded as though it were still rare. Every notch you drop the short interest threshold, you are including names where the squeeze mechanic is weaker. Every extra week of lookback, you are pairing insider purchases with staler short data.
Run it the other way. Keep the filters tight, accept that most weeks produce nothing, and write down the dates when the screen was empty. Three or four names a year that clear a 20 percent short interest threshold with a half million dollar officer purchase inside a tight window is a realistic yield, and each one deserves the several hours of business analysis that no screen is going to do for you. The alternative, a screen tuned until it always has something on it, is not a source of ideas. It is a source of positions.