The Market Reversal Engine describes itself as a multi-timeframe divergence detector built on four things: RSI bands, Bollinger extremes, volume climax and key-level rejection. Those four are not four versions of the same idea. The first two are measurements of how stretched a price is. The last two are evidence about whether the move has actually run out of fuel.
The distinction matters because stretch is common and exhaustion is rare. Anything in a strong trend is stretched, permanently, by definition. If your read of a reversal setup stops at the first two legs, you have selected for exactly the population of trades that keeps going without you.
Two legs measure distance, two measure supply
RSI in its upper band and a price outside the Bollinger extreme are both saying the same sentence with different arithmetic. The recent move has been large relative to its own recent history. That is genuinely useful information and it is not, on its own, a reason to fade anything, because the strongest trends in any market produce that reading continuously for days.
Volume climax and key-level rejection are different in kind. A climax is a statement about participation, which is to say about the number of buyers left to buy. A rejection at a level is a statement about location, which is to say that the move stopped somewhere specific rather than merely slowing down. Neither is derived from the price series alone in the way the first two are.
Put crudely, the first two legs tell you the elastic is stretched. The second two tell you whether anybody is still pulling.
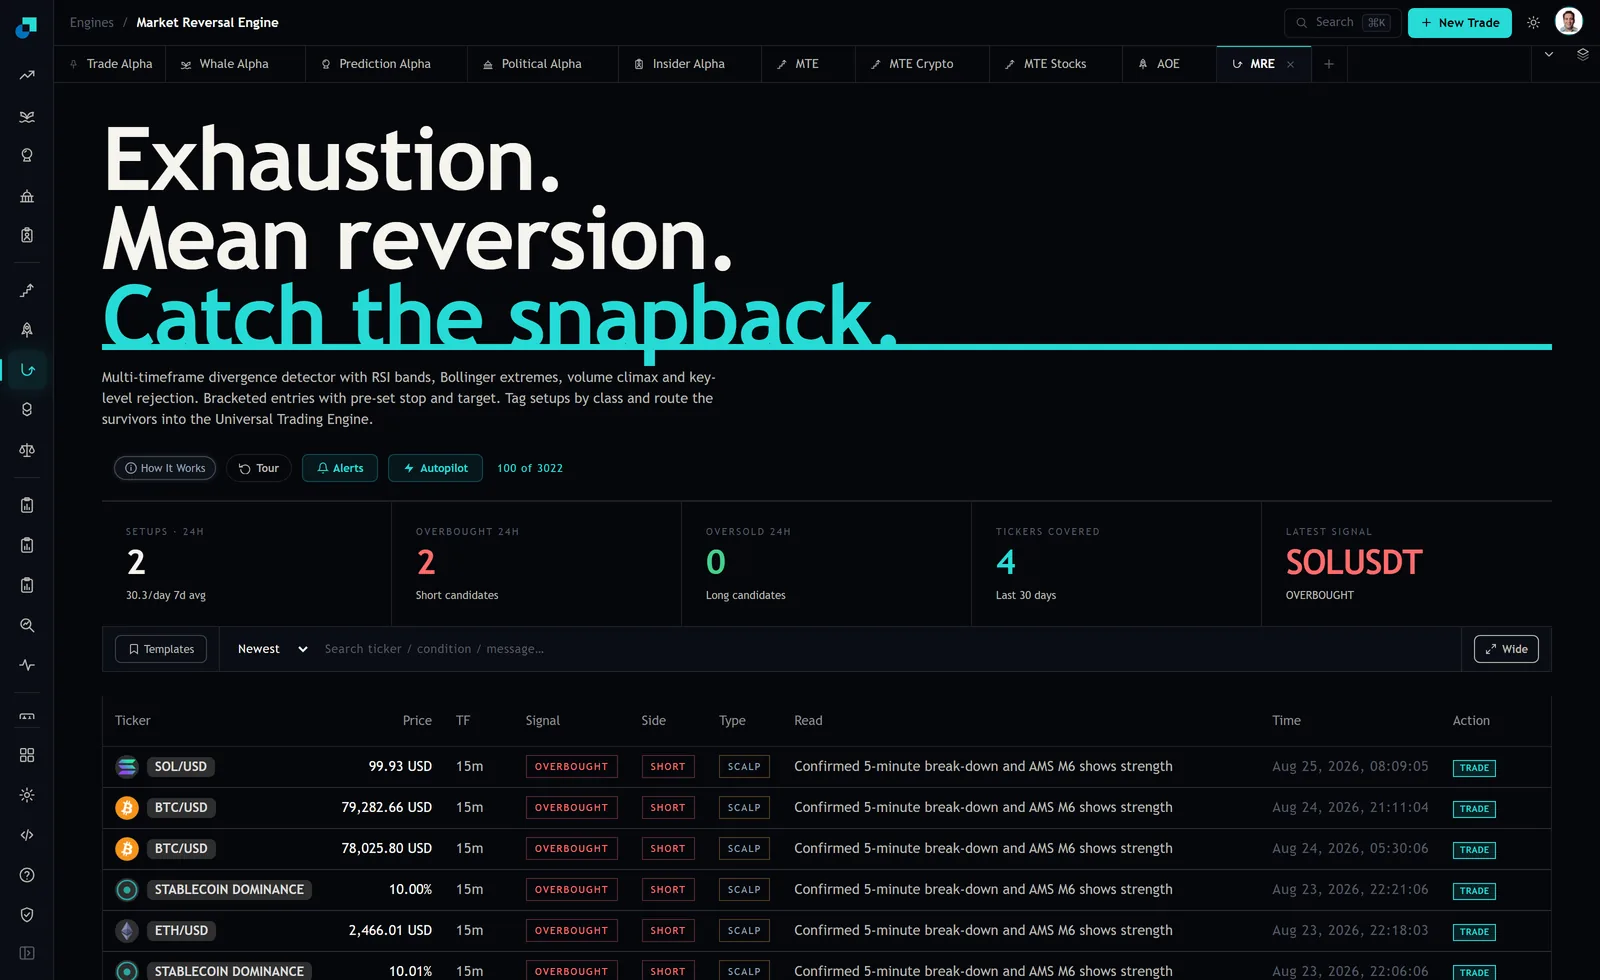
Notice what the feed does and does not give you. The Read column names a confirmation and an engine leg. It does not print a volume figure or a level for you to check, which means the last two filters are the part of the process where your own eyes still do work. That is not a gap in the product, it is the division of labour: the engine scans four thousand bar closes you would never look at, and you spend ninety seconds on the two rows that survive.
What a volume climax is, and what merely high volume is
High volume is not a climax. A trend can run for a week on elevated volume and that is participation, not exhaustion. A climax has a shape, and the shape is the tell.
What you are looking for is one or two bars of volume that are conspicuously larger than everything around them, printed into the direction the move has already gone, followed immediately by volume that falls off. The spike is the last cohort of buyers paying whatever is asked. The falloff is the absence of anybody behind them. Both halves are required. A spike with volume staying elevated afterwards is a breakout with follow-through, and fading it is how small accounts get taken apart.
There is a second pattern worth knowing, which is the volume spike into a bar that closes badly. Large volume with a price that finishes near the low of the bar, after an up move, means a lot of transacting happened and the buyers did not get to keep the gains. That combination of size and a poor close is worth more than either alone.
The practical version on a 15-minute chart is to look at the last thirty bars of volume and ask whether the recent spike is obvious without squinting. If you have to convince yourself it is a climax, it is not one. Real climaxes are visible from across the room.
A level only counts if it existed before the move
Key-level rejection is the leg people fool themselves with most, because levels are easy to draw after the fact and every high is a resistance level once the price has come off it.
The discipline is temporal. A level qualifies if you could have marked it before today's move arrived there. Prior swing highs, a range boundary the price has respected more than once, a prominent round number, the high of a previous session. If the level only became visible because the price just turned there, you have not filtered anything, you have named the thing that already happened.
So do the marking in advance. Ten minutes at the start of your week, on the handful of instruments you actually trade, marking three or four levels per chart. When a reversal row appears, the question is binary and takes five seconds: is the price at one of the levels I already drew, or is it in open space.
Rejection then means something specific. The price traded into the level and did not hold above it. In candle terms, a wick through with a close back inside is a rejection, and a clean close beyond it is not, whatever the RSI says. A setup that is stretched in open space has nothing to reject against, and in my experience that is the single most common way an otherwise sound reversal read turns into a loss: everything was true about the extension and there was no wall for the price to bounce off.
The trade that clears two legs and fails two
Picture the row you are about to be tempted by. A pair in a strong up move, RSI pinned in the upper band for hours, price riding outside the Bollinger extreme, and an OVERBOUGHT badge in the feed. Volume is steady rather than spiking. The price is above every level you drew last weekend, in air.
That is not a reversal setup. That is a description of a trend, and a trend that has left its levels behind is the specific market that manufactures the worst outcome available in this business: a short position that keeps being wrong at a faster rate than you can decide what to do about it.
Put a dollar figure on it so it stays real. A 400 dollar position with a stop that gets skipped past by a running move does not cost you the 400 dollars you planned, it costs whatever the market wanted, and the reason people override the stop in that moment is precisely because the extension read said the move was already unreasonable. Being early and being wrong feel identical from inside the position. The two price-action legs are what separates them beforehand, when the distinction is still cheap.
The ninety second check before you take an overbought row
Take the surviving rows and run the same three questions every time, in the same order, on the timeframe the row names.
- Is there a volume spike in the last few bars that is obvious at a glance, with volume falling off behind it? If volume is flat or still building, stop here.
- Is the price at a level I drew before today? If it is in open space, stop here.
- Did the level actually reject, meaning a push through and a close back inside, rather than a close beyond it?
Rows that fail question one or question two are not weaker versions of the setup. They are a different setup, and it is one where the extension reading is a trend signature rather than an exhaustion signature. The engine has done the scanning, and this is the part where you get to say no cheaply, which is the only part of the day where saying no costs nothing at all.