The Consensus tab is built to answer a question about entry. Which way is tracked money leaning, and how hard. Used that way it is a momentum screen with a small population, and it will point you at the side that is already full.
Invert it and the same card answers a question the risk function actually needs. If I am on this side, who is left to sell to. Every dollar counted on your side of a consensus bar is a dollar that is not available to take your position off you, and the board publishes both sides of that split.
The ratio the card already contains
Each card shows a whale count, a dollar total, and the split of those dollars across the two sides. Define one number from it and put it in your risk file: the opposite-side dollars divided by the same-side dollars. Call it cover. It is a crude proxy for how much tracked, informed money could absorb your exit without a new participant arriving.
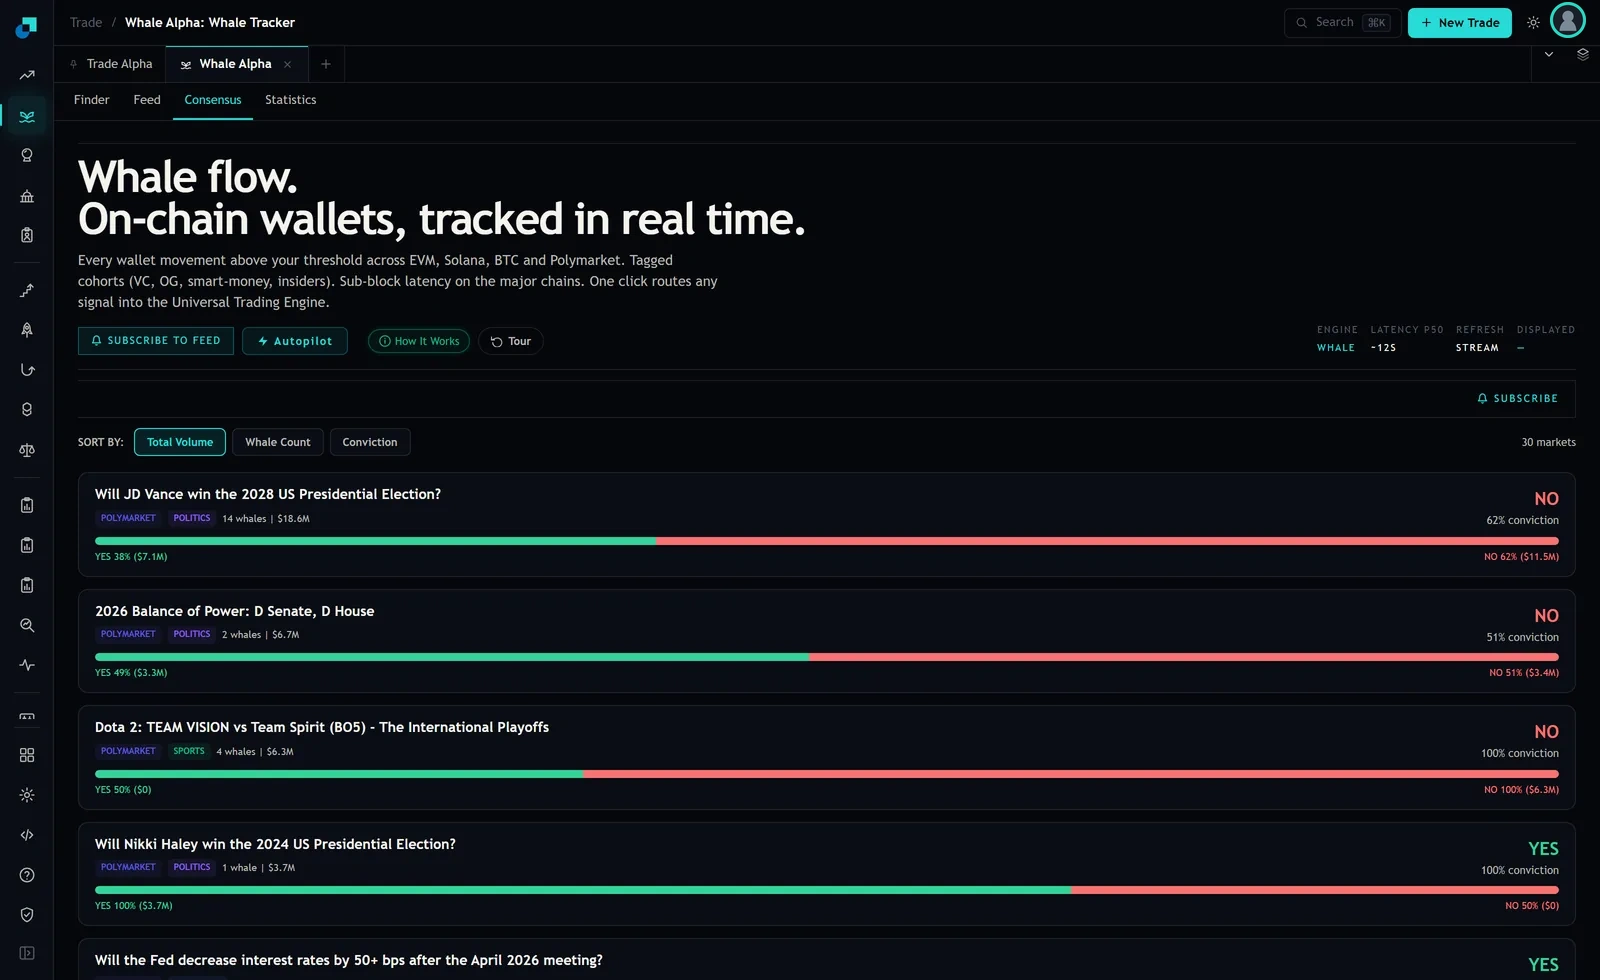
Run it on the board as it stood at capture, with 30 markets loaded and the default sort on total volume.
The largest card, a Polymarket question on the 2028 presidential race, showed 14 whales and 18.6 million dollars, sitting NO at 62 percent conviction, with YES at 38 percent on 7.1 million and NO at 62 percent on 11.5 million. If you are NO, your cover is 7.1 over 11.5, or 0.62. Sixty two cents of opposing tracked money for every dollar of yours.
The second card, on the 2026 balance of power, showed 2 whales and 6.7 million dollars at 51 percent conviction NO, with 3.3 million YES against 3.4 million NO. Cover on the NO side is 0.97, which looks superb until you notice the whale count is two, and a cover ratio computed from two wallets is a statement about one counterparty.
The zero-cover case, which is the one that hurts
The third card at capture was an esports market showing 4 whales and 6.3 million dollars, NO at 100 percent conviction, with the YES side reading 50 percent and zero dollars. The fourth was a stale presidential question with 1 whale and 3.7 million dollars, YES at 100 percent conviction, and again nothing on the other side.
Cover on both is 0.00. Read as entry signals these are the two strongest cards on the board. Read as risk they are the two worst positions on the board, because the entire tracked cohort is already where you would be, and the exit has to come from participants the tracker does not classify as whales at all.
That is the whole inversion in one comparison. The conviction bar and the cover ratio are computed from the same two numbers and they rank the board in opposite orders. A desk that sizes on conviction is systematically largest exactly where its exit is thinnest.
Turning cover into a limit rather than a comment
A ratio that lives in a research note changes nothing. Three rules that bind, and the reasons they are set where they are.
- Below three distinct whales, cover is not defined. Two wallets are not a market, and a ratio built from them will swing between 0 and infinity on a single participant's decision. Cards under the count floor are eligible for a starter position sized from your own risk budget, with no reference to the board at all.
- Cover below 0.25 caps the position at whatever you are willing to hold to resolution. This is the practical test. If the only exit is the resolution date, then size the position as though there is no exit, because the ratio is telling you there is not one.
- Cover is re-read on a schedule, not at entry only. The cohort moves. A card at 0.9 cover when you entered can be at 0.2 a week later without the price having moved much, and the position has become materially riskier while looking identical in the book.
The scheduled re-read is the rule people skip and it is the one that catches the failure. Crowding is not a property of your entry, it is a property of the current holder base, and the only reason to look at a tracked cohort at all is that it updates.
What the ratio is not measuring
Three limits, all of which belong in the same paragraph of the risk memo as the ratio itself, because a number without its caveats travels further than it should.
The cohort is not the book. Cover counts tracked whale dollars, and the platform's own statistics tab put the total tracked population at 26,687 wallets. Every participant outside that set is invisible to this ratio, so cover is a lower bound on real liquidity and simultaneously an upper bound on informed liquidity. Those two facts pull in opposite directions and neither of them is conservative on its own.
Dollars are not shares. The board reports notional on each side, and notional at a price of 0.9 buys a very different number of contracts than notional at 0.5. If your exit is measured in contracts, convert before comparing.
And the board goes stale. The fourth card at capture was a question about the 2024 presidential election, still displaying 100 percent conviction on 3.7 million dollars. Whatever that card is measuring, it is not current positioning in a live market, and a cover ratio computed from a settled or abandoned question is arithmetic performed on a fossil. Check the market is live before the number means anything.
Where this belongs in the process
Cover is not an entry screen and it will not improve one. It belongs at the point where a position size is set, and again at every risk review while the position is open, and it should be recorded with its inputs rather than as a single figure, because a ratio of 0.62 built from 14 wallets and a ratio of 0.62 built from 3 are not the same reading and will not age the same way.
The sentence you want in the file is boring and complete. On this date, this market showed this many whales and this dollar split, our side held this share, cover was this, and the position was capped at this size for that reason. When the trade goes wrong, and some of them will, that sentence is the difference between a decision that was sized to its evidence and one that was sized to a coloured bar.