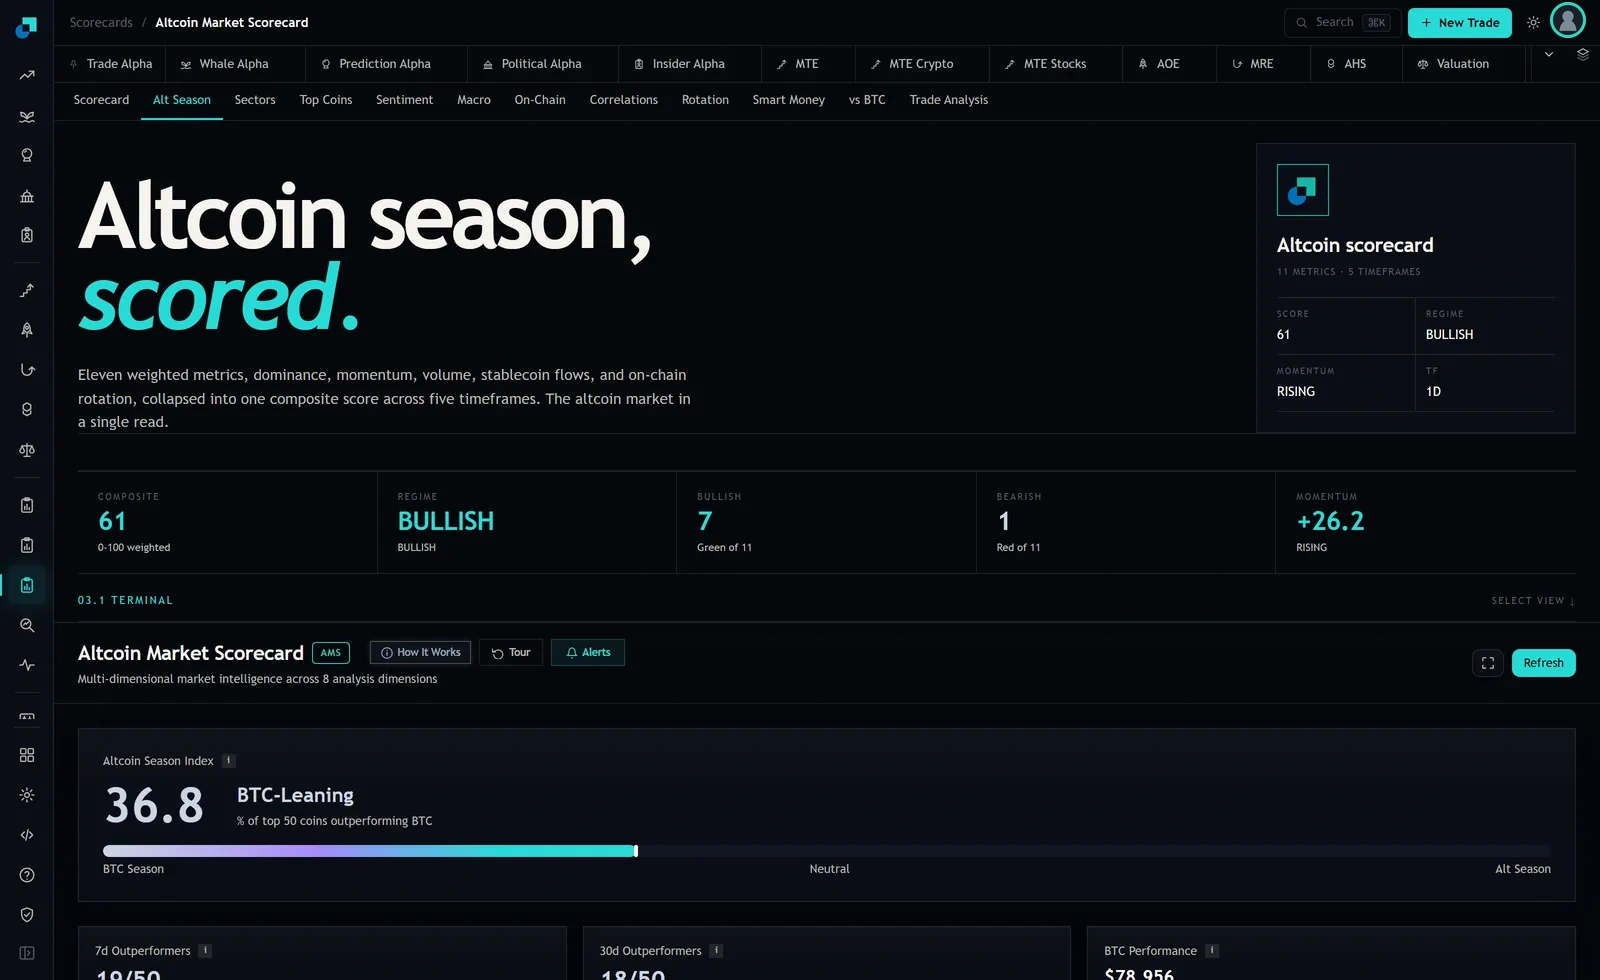
The Alt Season Index measures the percentage of the top 50 altcoins outperforming Bitcoin. That is the module's own description of it, and the word doing the damage is outperforming. Outperforming is a comparison, not a direction. A coin that fell 12 percent while Bitcoin fell 20 percent outperformed Bitcoin. It counts as a win in the breadth statistic, and the person holding it is down 12 percent.
Which means the gauge can print a high reading in the middle of a market that is losing money in every direction, and nothing has gone wrong. The measure did exactly what it says on the label. The mistake is in the reading, and it is a common one, because everyone has absorbed the shorthand that alt season means alts are going up.
The comparison has no floor under it
Any relative measure is a subtraction. You are asking whether one number beat another number, and subtraction does not care whether either of them is positive. Once you see the gauge that way, the failure mode stops being surprising and becomes predictable.
There are four states the market can be in, and the gauge reports the same thing in two of them.
| Bitcoin over the window | Most alts versus Bitcoin | Gauge reads | What you actually experience |
|---|---|---|---|
| Up | Better | High | The alt season people mean |
| Up | Worse | Low | Bitcoin-led rally, alts lag |
| Down | Better | High | Everything falls, alts fall less |
| Down | Worse | Low | Broad liquidation, alts hit hardest |
Rows one and three both produce a high reading. Row one is an invitation. Row three is a warning, and it looks identical if you only read the one number.
The filter is one number and it is not on the panel
The fix is small enough that there is no excuse for skipping it. Before you act on a high breadth reading, look up Bitcoin's own return over the same lookback window the gauge is using. If that number is negative, the gauge is describing a less-bad decline, and a less-bad decline is not a reason to buy anything.
Two practical notes on doing this properly. Use the same window. Comparing a breadth reading built on a rolling quarter against Bitcoin's last week is comparing nothing to nothing, and it will give you a false green light roughly as often as a false red one. And take Bitcoin's return from your own chart, in whatever currency your account settles in, because that is the number your position size is denominated in.
The captured tab list on the scorecard includes Alt Season, Top Coins and a vs BTC tab alongside the main scorecard, so there is more than one place to look before you decide. What I would not do is assume any single panel is already applying the absolute filter for you. Check Bitcoin's own return yourself, because it takes two minutes and it is the difference between the two rows that look the same.
Why this specific trap shows up in bear markets and not randomly
It would be less dangerous if the false signal were rare. It is not, and there is a mechanical reason.
Altcoins usually fall further and faster than Bitcoin at the start of a liquidation. Leverage is thinner, order books are shallower, and the marginal seller in a panic sells the thing with the least support. That first leg puts the breadth reading on the floor, which is honest, and it is generally the only part of the sequence people describe correctly.
What happens next is the trap. Having already fallen 60 percent, an alt has less distance left to fall than Bitcoin does at minus 25 percent. The second leg down hits Bitcoin harder in percentage terms simply because it has more room, and the alt that has already been destroyed drifts sideways in a thin book. Sideways beats a further decline. Breadth rises. The gauge climbs during a bear market's second leg because the wreckage has stopped moving, not because anything is accumulating.
That is the environment where the reading is most likely to be high and most likely to be misread, and it is exactly the environment where buying feels defensible because everything is cheap relative to where it was.
What to write down before you buy anything this week
The version of this that survives contact with a busy week is a two-line note, written before you open a position rather than after.
Line one is the breadth reading and the window it covers. Line two is Bitcoin's return over that same window, with a sign in front of it. If line two is negative, the rule is that you do not open a new alt position on the strength of line one. You can still buy for other reasons, you can still average into something you were already scaling into, but the breadth number is not permitted to be the reason. That distinction is the whole discipline.
If both lines are positive, you have a genuine breadth reading, and then the rest of the usual questions apply: whether it is early or late in the move, what you are selling to fund the purchase, and what the position costs to unwind in fees and spread if you are wrong. The absolute filter does not answer any of those. It only stops you from spending the effort on a market that is going down.
The second read that costs another thirty seconds
One number and one filter is enough for most weeks. When you want a sanity check on top of it, the composite score exists for exactly this and it is built differently, which is the point of consulting it.
The scorecard collapses eleven weighted metrics across five timeframes into a single 0 to 100 read, and at the time of writing its header showed a composite of 61 with a regime of BULLISH and momentum RISING on the daily timeframe. The metrics feeding it include dominance measures, funding rates, open interest, stablecoin flows and exchange reserves, which are descriptions of positioning and available capital rather than restatements of returns that already happened. A breadth reading that is high while the composite is weak is worth pausing over, because the two are measuring different things and the disagreement is information.
None of this makes the gauge a bad instrument. It makes it a relative instrument, and relative instruments need an absolute companion or they will eventually walk you into a purchase during a decline, confidently, with a high number on the screen the whole way down.