The gauge reads high, the group chat is celebrating, and your five tokens have done nothing for a fortnight. Before you decide the number is broken or that you are cursed, it is worth understanding exactly what the reading counts, because there are two specific gaps between it and your account, and both of them are large enough on their own to explain what you are seeing.
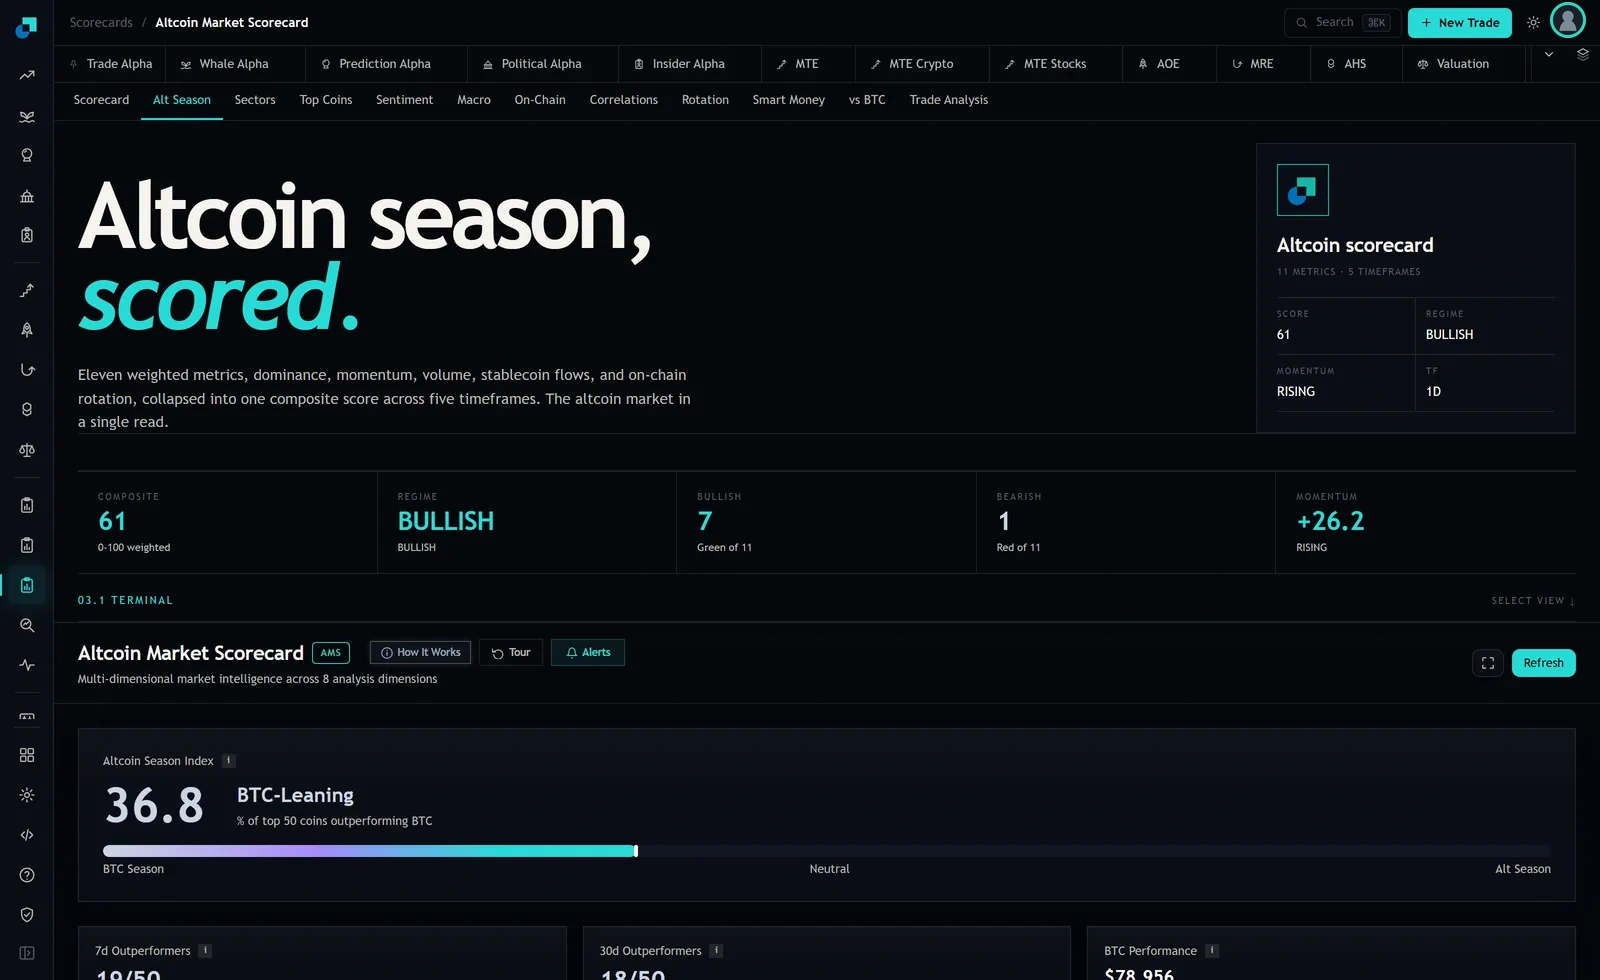
The Alt Season Index measures the percentage of the top 50 altcoins outperforming Bitcoin. Every word of that definition is doing work, and the two words doing the most are "top 50" and "outperforming".
Eighty percent of fifty is not eighty percent of your five
Suppose the gauge reads 80. If your five holdings were drawn at random from the top 50, you would expect four of them to be beating Bitcoin, and the chance that all five were lagging would be tiny, about three in ten thousand. So if all five are lagging, the odds are overwhelming that your holdings are not a random draw from that universe, and they never were.
They are a selected draw, and usually selected in ways that correlate with each other. People buy what they read about, and what they read about clusters by narrative, by sector, and by size. Five tokens chosen because they were all interesting for related reasons are closer to one position than to five independent ones, and one position can easily be on the wrong side of an eighty percent reading.
The bigger issue is the universe. If your tokens are not in the top 50 by market capitalisation, the gauge does not include them at all. Not underweighted, not diluted, absent. A reading of 80 is then a statement about fifty assets, none of which you own, and expecting it to describe your account is a category error rather than bad luck. Check where your holdings actually sit by size before you interpret any market-wide breadth number. For a lot of retail portfolios that single check ends the investigation.
Beating Bitcoin is not the same as going up
This is the misread that costs people the most, and it hides in plain sight in the word "outperforming".
The test is relative. A token that fell 6 percent while Bitcoin fell 12 percent has outperformed Bitcoin and counts toward the reading. So does a token that fell 20 percent while Bitcoin fell 25. In a market where everything is sliding and altcoins are sliding slightly less, the breadth gauge can read high while every position you own is red, and both facts are correct at once.
The gauge is not being misleading here. It is answering a rotation question, whether capital is favouring altcoins over Bitcoin, and that question is legitimately relative. But the question you have when you open your account is directional, whether your holdings are going up, and a relative measure cannot answer a directional question. Any time the gauge is high and you are red, check what Bitcoin did over the same window before drawing any other conclusion. If Bitcoin is down over the period, the mystery usually dissolves right there.
The personal breadth check that replaces the market one
The market gauge answers a question about fifty tokens you mostly do not own. Build the version that answers the question about the ones you do. It takes about five minutes in a spreadsheet and you can rerun it weekly.
Pick a window and keep it fixed. Thirty days is a reasonable default. Get each holding's return over that window, get Bitcoin's over the exact same window, and count. The numbers below are made up to show the shape of the output rather than to describe any real market.
| Holding | 30 day return | Bitcoin over the same window | Beat Bitcoin |
|---|---|---|---|
| Token A | plus 4 percent | minus 5 percent | Yes |
| Token B | minus 9 percent | minus 5 percent | No |
| Token C | minus 2 percent | minus 5 percent | Yes |
| Token D | minus 22 percent | minus 5 percent | No |
| Token E | minus 6 percent | minus 5 percent | No |
Two of five beat Bitcoin, so your personal breadth is 40 percent, and your account is down in absolute terms because Bitcoin itself was down over the window. Notice how much more that tells you than the market reading did. You now know your breadth, you know the direction, and you know that one position is responsible for most of the damage.
What the gap between your breadth and the market's actually means
Once you have both numbers, the difference between them is the diagnostic, and it points at three different problems with three different responses.
A large gap, market breadth high and personal breadth near zero, is a selection result rather than a market result. Nothing about the market is stopping your tokens from moving. Something about what you chose is. The next question is which of the obvious candidates it is, and the Sectors tab is the fastest place to look, since it breaks performance down by DeFi, layer one, layer two, gaming, AI and the rest. If your holdings are concentrated in one sector and that sector is at the bottom of the heatmap, you have your answer and it took two minutes.
A moderate gap with one extreme loser, which is the shape of the worked example above, is not a portfolio problem at all. It is a single-position problem being averaged into everything else. Pull that position out and look at the other four on their own before making any decision that touches all of them.
No gap, with your breadth roughly matching the market's while you are still red, means you own broadly what the market owns and the market is down. There is nothing to diagnose. The only decisions left are about size and time horizon, and no breadth statistic is going to make either of them for you.
The test to run before you act on any of it
The check produces a number, and a number tempts action, so it is worth having one question standing between the two.
For each holding that has failed the breadth test repeatedly, ask whether you would buy it today, at today's price, with fresh money, knowing what you now know. Not whether it might come back. Whether you would buy it. If the answer is no, then continuing to hold it is a decision you are making by default rather than on purpose, and the personal breadth check has just given you evidence for a conversation you were having with yourself on feelings alone.
If the answer is yes, write down why in one sentence, along with the date. Three months of those sentences is the most useful record a small account can keep, because it lets you see whether your reasons for holding kept changing while the position kept falling, which is the pattern that turns a trade into something you are still explaining to yourself a year later.