Most monitoring failures on a systematic sleeve are not failures of coverage. The desk was looking at the right metrics. It was looking at all of them at the same frequency, which means a webhook that stopped delivering on Tuesday morning and a Sharpe that has been sliding for two quarters arrived in the same review, competed for the same half hour, and the loud one won. Execution faults are loud. Decay is quiet and expensive.
The fix is not a better dashboard. It is a cadence document that assigns every metric one frequency, one owner and one numeric trigger, agreed before the sleeve goes live. Three lists, three clocks.
What the deployments surface hands you, and what it does not
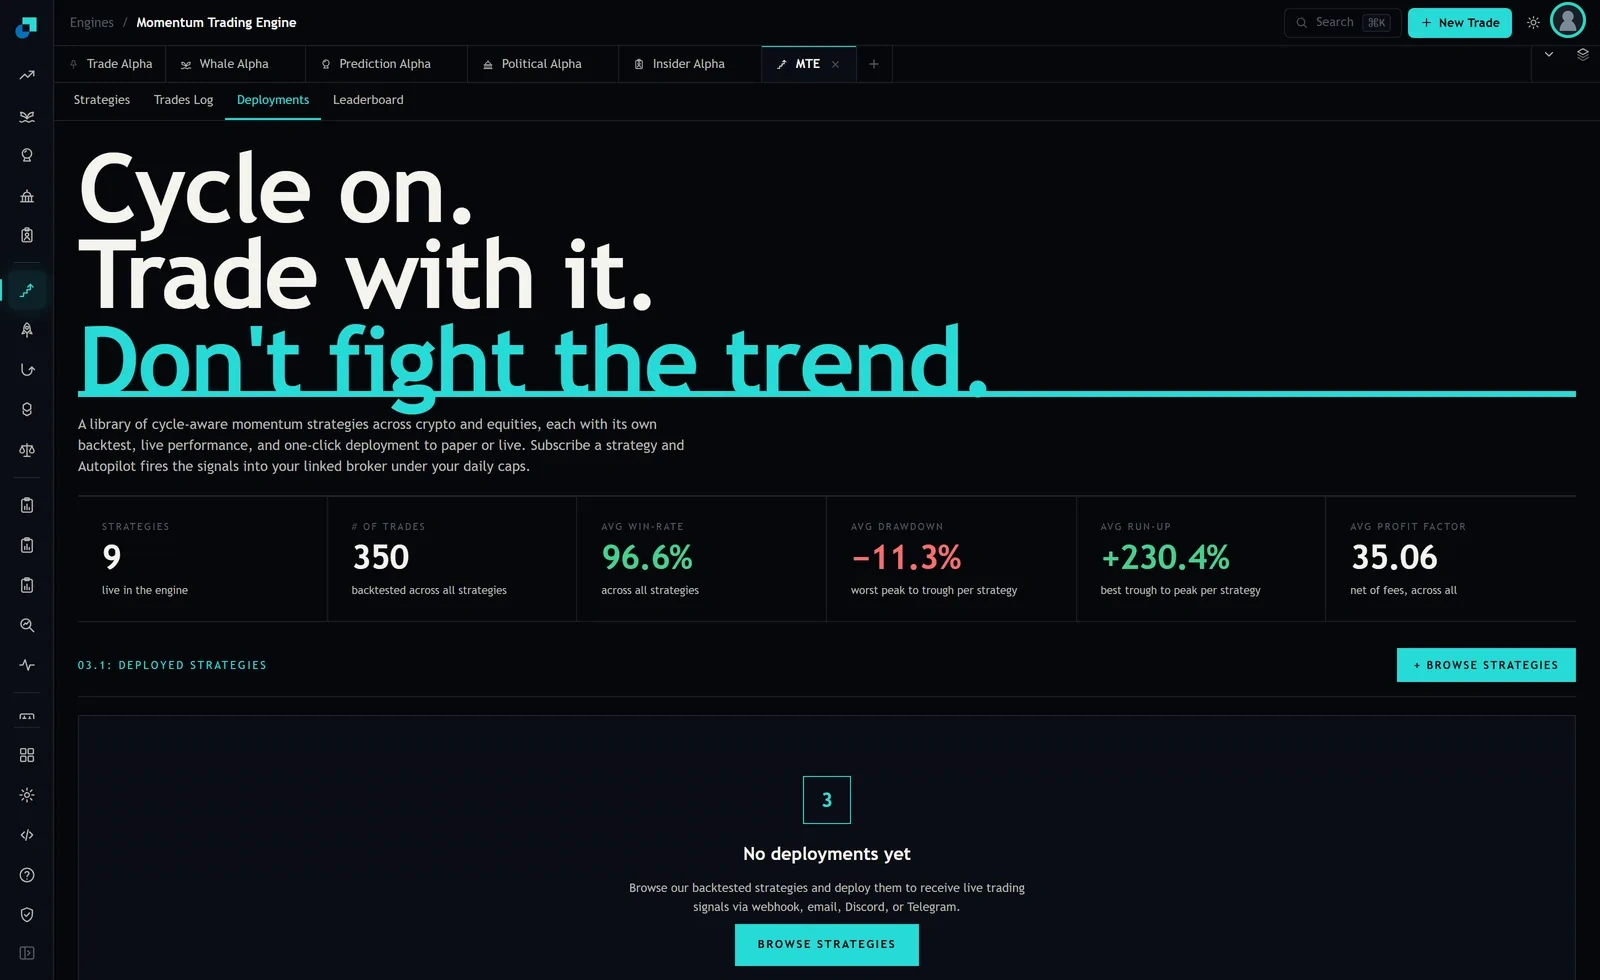
Start with what is actually on the screen, because the cadence has to be built around the real product rather than an imagined one. The deployments tab presents a panel headed DEPLOYED STRATEGIES with a browse action beside it. At capture it was an empty state, reading that there were no deployments yet and inviting the user to browse the backtested strategies and deploy them to receive live trading signals via webhook, email, Discord or Telegram.
Two consequences. First, a deployment on this engine is a delivery arrangement. The engine emits signals into a channel, and everything that turns a signal into an order, along with everything that could fail in that chain, sits downstream in your own stack. Your daily list is therefore mostly about your infrastructure, not about the vendor's.
Second, the six tiles across the top of the page are library statistics, not deployment monitoring. They read 9 strategies live in the engine, 350 trades backtested across all strategies, an average win rate of 96.6 percent, an average drawdown of minus 11.3 percent described as worst peak to trough per strategy, an average run-up of plus 230.4 percent, and an average profit factor of 35.06 net of fees. Every one of those is a backtest aggregate over the whole library. None of them moves when your deployment has a bad month. If someone on your desk is glancing at that row and feeling reassured, they are reading a brochure.
The daily list contains facts, never statistics
Everything on the daily list must be answerable as yes or no by someone who is not the strategy's author. Nothing on it may require a judgement about performance.
Four checks. Did every signal the engine emitted reach the execution layer, counted, not sampled. Did every signal that reached the execution layer produce an order or a logged, reasoned rejection. Does the open position count in your book match the position count implied by the signal history. And did each alert channel deliver something, including a heartbeat on a day with no signals, because a silent channel and a quiet market are indistinguishable until you check.
The owner is whoever is on the desk that day, named on a rota, not a team. The trigger is any non-zero count in the mismatch columns. Escalation is same day to the head of trading, and the sleeve is paused if a mismatch cannot be explained within the session. Nobody needs a committee to decide that an order which should exist does not exist.
Slippage belongs on the daily list too, but as a fact and not a verdict. Log the signal price against the fill price in basis points per trade, and stop there. A single day's slippage tells you nothing about execution quality and everything about whether the pipe is connected.
The weekly list is attribution, not performance
Weekly is where you first allow interpretation, and the question is always the same one. Is the gap between what the strategy did on paper and what the account did explained by things you already know about?
Run the week's realized P&L against the signal-implied P&L and decompose the difference into three buckets: delay, spread and size. Delay is the move between signal timestamp and fill timestamp. Spread is the crossing cost at the moment of the fill. Size is the difference between the notional you intended and the notional you got. Any residual that will not sit in one of those three buckets is the interesting number, and it is the one that goes to the strategy owner with a name attached.
Also weekly: cumulative slippage in basis points per round trip against the assumption used when the sleeve was funded, participation rate against average volume for the largest position, and the correlation of daily returns between deployments. That last one is the metric desks skip and then regret. A book of nine momentum strategies is not nine bets, and the week you discover the effective number is closer to three is the week they all draw down together.
Owner is the strategy owner. Trigger is a residual larger than the funded cost assumption for two consecutive weeks, or realized correlation exceeding the assumption used in sizing. Escalation is to the investment committee at its next scheduled meeting, with the decomposition attached.
Monthly is the only place a performance statistic gets a vote
Rolling Sharpe, drawdown against the backtest maximum, hit rate against the backtested rate, and the parameter change register all belong on the monthly list, and putting them anywhere faster is actively harmful. Here is the arithmetic that says so.
The standard error of a Sharpe estimate over a sample of length T is approximately the square root of one plus half the squared Sharpe, all divided by T. The engine reports 350 backtested trades across nine live strategies, roughly 39 observations each. At a Sharpe near 1.5, that gives a standard error of about 0.24. Two thirds of the sampling distribution spans nearly half a unit of Sharpe. A desk reading that number weekly is reading noise, and a desk that reads noise weekly will eventually act on it, always in the direction of cutting the strategy that has just been unlucky.
So the monthly review compares against pre-registered bands rather than against last month. The bands are set at funding, from the backtest's own sample length, and they say what a normal bad month looks like. Drawdown is the exception worth handling asymmetrically: breaching the backtested maximum drawdown is a monthly metric with a daily override, because when it breaches you want to know that day even though you will not analyse it until the review.
Owner is research jointly with risk. Trigger is a breach of a pre-registered band, and escalation is a written decision, hold or cut or resize, with the reasoning recorded at the time rather than reconstructed later.
The document itself, and the part people leave out
Write it as one table with four columns and no prose: metric, frequency, owner by role, numeric trigger. If a row cannot be given a number, it does not belong on any list, because a metric without a threshold is a metric that gets discussed and never acted on.
| Metric | Clock | Owner | Trigger |
|---|---|---|---|
| Signal to order reconciliation | Daily | Desk rota | Any mismatch |
| Alert channel heartbeat | Daily | Desk rota | Any silent channel |
| Slippage decomposition | Weekly | Strategy owner | Residual above funded assumption, twice |
| Cross-deployment correlation | Weekly | Strategy owner | Above sizing assumption |
| Rolling Sharpe against band | Monthly | Research and risk | Outside pre-registered band |
| Drawdown against backtest max | Monthly, daily override | Risk | Breach of backtested maximum |
The part that gets left out is the escalation clock. An owner without a deadline is a suggestion. Each trigger needs a stated interval inside which the owner must produce a decision, and a stated default if they do not, which for a live sleeve should be to reduce rather than to continue. Defaulting to continue is how a sleeve stays funded through three consecutive breaches while everyone waits for someone else to call the meeting.