The word at the top of the MRE page is Exhaustion. The word most people substitute for it in their head is Top. Those are not the same claim, and the gap between them is where a lot of small accounts get run over shorting things that were only halfway up.
The useful thing is that you do not have to guess which one you are looking at from the tag alone. The conditions that produce an overbought row are written down, and once you read them the ambiguity stops being mysterious and starts being structural.
The signal is defined to fire inside strength
The alert definitions behind these setups, which the platform tags as native to MRE, spell the short-term overbought condition out as four terms joined by AND. RSI above 80. MFI above 80. CMF above minus 0.2. MMS above 80.
Read that fourth term again. MMS is the Multi-Timeframe Momentum Scorecard, which runs across six timeframes, and the condition requires it to be above 80. The engine will not call an overbought setup unless momentum across the timeframe stack is already close to as strong as it gets. That is not a bug. Exhaustion, by definition, is a thing that happens at the end of a strong move, so a detector for it has to be pointed at strong moves. But it means every single overbought row you will ever see arrives while the trend is in excellent health, and your instinct that the chart looks strong is not a reason to doubt the signal. It is a precondition of the signal.
Now look at the third term, because it is the one that quietly refuses to do the job people assume it does. CMF above minus 0.2 is a floor, not a demand. It permits money flow to be mildly negative and it does not require money flow to be deteriorating. So the condition set detects an extreme sitting inside strength. It does not, on its own, detect buyers being withdrawn. Those are different events and only the second one is exhaustion in the sense you care about.
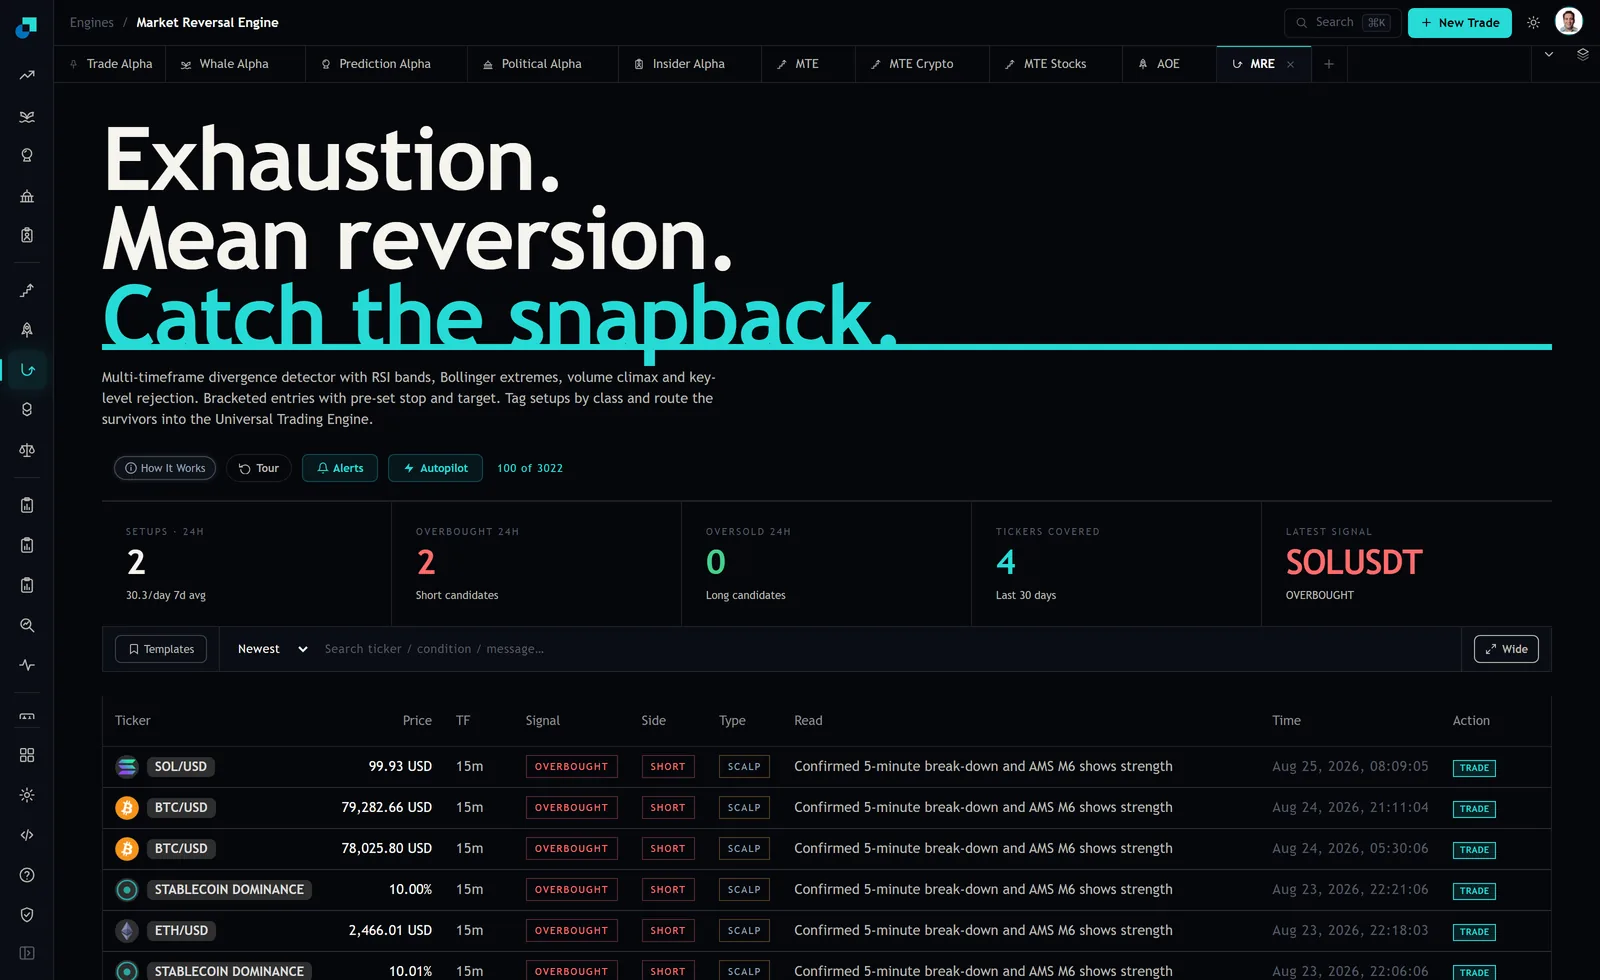
Every row says the same thing, which is exactly the problem
The Read column is the field that is supposed to carry the context, and in the capture it carries the identical sentence on all six visible rows: confirmed 5-minute break-down and AMS M6 shows strength. Same phrase on SOL at 99.93, on both BTC rows, on ETH at 2,466.01, and on both stablecoin dominance rows.
Two things follow. The first is that the breadth leg is telling you the trend is confirmed at the same moment the signal is telling you to fade it. That tension is the whole subject of this post and the panel does not resolve it for you.
The second is more practical and slightly deflating. A field that reads identically on every row in front of you cannot be a tiebreaker today, because it is not breaking any ties. If you were planning to sort the feed by whether the AMS leg agreed or disagreed, that plan does not survive contact with this capture. I cannot tell you there is a control on the panel that filters rows by breadth agreement, because I cannot see one, and the columns that exist are Ticker, Price, TF, Signal, Side, Type, Read, Time and Action. What you have is a sort order, a search box over ticker, condition and message text, and your own judgement.
One more caution on that string. AMS M6 is a class label. The panel does not define what M6 denotes, and neither will I, because guessing at it and being wrong would be worse than leaving it alone. Read it as what it plainly says, which is that a breadth leg was consulted and it reported strength.
Where the tiebreak actually has to come from
If the Read column is constant, the discriminating information lives one level up, in the three engines that feed the score. The MRE page names them. AMS combines eleven breadth and on-chain metrics. MMS runs momentum across six timeframes. GLS tracks eight central bank balance sheets.
The question you are trying to answer is narrow: is participation in this move still widening, or is the move being carried by fewer and fewer things? That is what separates a pullback from a top, and it is a breadth question rather than a price question. Price at an extreme is the one fact you already have from the tag.
So the check is to open the scorecard rather than the chart. You are looking at whether the composite is rising or rolling over, and whether the regime and momentum fields agree with each other. A composite that is high and still climbing while a 15m instrument prints overbought describes a market where the extreme is local and the crowd is still arriving. A composite that is high and flattening while price makes a new extreme describes the narrowing that actually precedes exhaustion. Those two states get the same tag in the feed and deserve completely different treatment.
The Type column already told you which trade this is
There is a simpler tell sitting in plain sight, and it is the one I actually use when I am short of time.
Every visible row is stamped SCALP on a 15m timeframe. That is not decoration. It is the module classifying the setup as a short-duration fade, and the entries ship bracketed with a pre-set stop and target. A scalp-class fade against a trend that the momentum leg has certified as strong is a trade with a defined exit, and its entire logic depends on you taking that exit.
The mismatch is between clocks. A 15m overbought reading inside a momentum score that is above 80 across six timeframes is, in plain terms, a stretched short-term move inside an intact longer-term one. The reversion you are being offered is the reversion of the fifteen minute stretch. It is not the reversion of the trend, and treating it as though it were is the single most expensive misreading available on this page. The trade that loses the most money here is not the one that fails. It is the one that works, gets you paid on the bracket, and then convinces you to stay short because you were right.
Three questions before you take an overbought row
This takes about two minutes and it is the difference between fading a stretch and calling a top.
- Is the breadth composite still rising, or has it flattened while price made a new high? Rising means take the bracket and leave. Flattening is the only condition under which the word exhaustion is doing real work.
- How many rows on the same instrument have printed recently? Two BTC rows appear in the capture, stamped Aug 24 2026 at 05:30:06 and 21:11:04, at 78,025.80 and 79,282.66. A second overbought print at a higher price is not a stronger signal. It is the first one having been wrong so far.
- Would I hold this if the tag said continuation instead of overbought? If the answer is no, you are trading the label rather than the setup, and the position size should reflect that.
The uncomfortable part is that none of this gives you certainty, and anybody selling you a rule that separates tops from pullbacks in advance is selling you hindsight. What the conditions do give you is an honest description of what you hold. An overbought MRE row is a short-duration fade against a trend the engine itself has measured as strong, with a stop and a target attached, and the correct way to size it is as the fade it says it is rather than as the top you would like it to be.