Most macro content stops at the interesting part and skips the part that costs money. You read that global liquidity is expanding, you nod, and then nothing happens, because between the read and the order there are about six decisions nobody wrote down for you. This is those six decisions, worked through at 5,000 dollars, which is a size where the arithmetic of costs genuinely changes what you should do rather than being a rounding error you can ignore.
Reading the tab without over-reading it
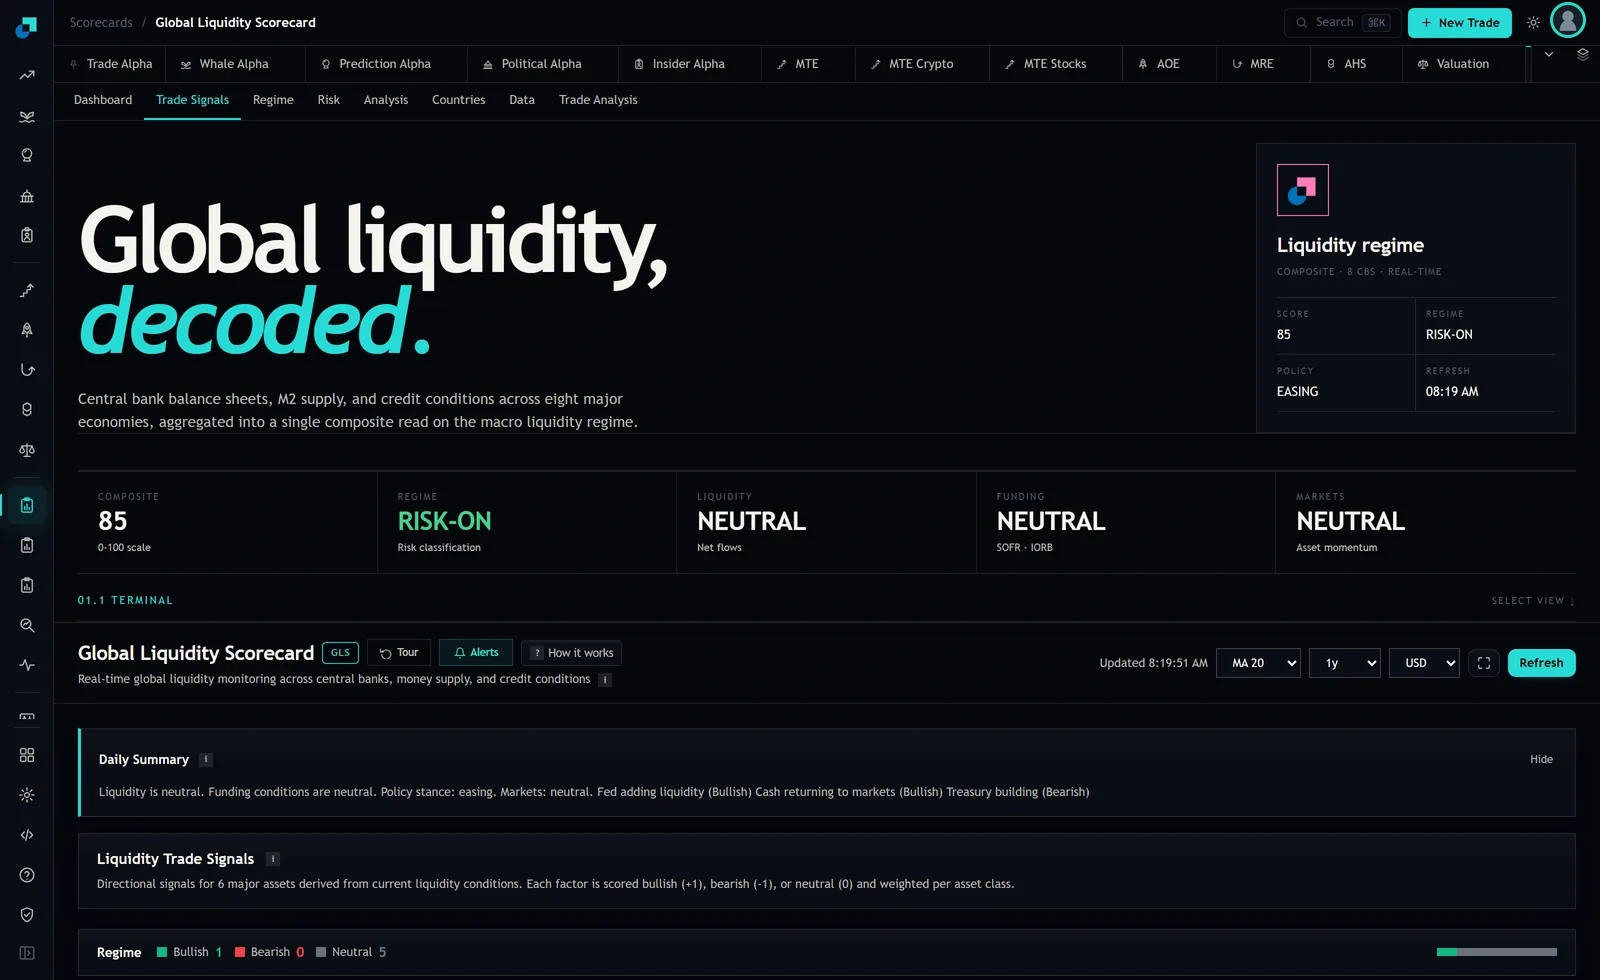
Start from what is actually on the screen. The Global Liquidity Scorecard header is showing a composite of 85 on a 0 to 100 scale, a regime read of RISK-ON and a policy read of EASING, with a refresh stamp in the corner. The Trade Signals tab underneath carries a Liquidity Trade Signals panel covering six major assets, where each factor is scored bullish (+1), bearish (-1) or neutral (0) and weighted per asset class.
Now the part that matters for your ticket. The tally under that panel reads Bullish 1, Bearish 0, Neutral 5. Five of the six assets are not making a call. The three component reads across the header strip say LIQUIDITY NEUTRAL on net flows, FUNDING NEUTRAL on the SOFR and IORB relationship, and MARKETS NEUTRAL on asset momentum.
So the honest one-line summary of this screen is: the composite is high, the regime label is risk-on, and almost nothing underneath is confirming that with conviction. That is a page that supports staying at your normal exposure. It is not a page that supports adding.
Three expressions that are not worth it at 5,000 dollars
Before the expressions that work, the ones that do not, because most small-account damage is done here.
Anything with a fixed cost per leg. If an instrument or venue charges a flat fee, that fee is a percentage of your position, and at 5,000 dollars split across two or three positions the percentage gets ugly fast. Take your all-in cost for a round trip and divide it by the position size. If that number is above about half a percent, you have handed away a meaningful part of any plausible move before you start.
Anything leveraged or path-dependent that you intend to hold for weeks. A macro liquidity view is a multi-week to multi-month view by nature, because the underlying data arrives on weekly and monthly calendars. Instruments engineered for daily exposure do not do multi-week views, and the gap between what you expected and what you got will be attributed by you to the signal being wrong.
Anything requiring more than two positions. At 5,000 dollars, a five-position expression of a macro view means five spreads, five sets of costs and five things to monitor, in return for diversification you could have bought inside a single broad fund. Complexity is a cost you pay in attention, and attention is the resource a time-constrained retail investor has least of.
Sizing so that being wrong is survivable
Here is the sizing frame I would use, and the numbers are deliberately boring.
Split the account into a core and an overlay sleeve. The core is what you own regardless of what any dashboard says, and at 5,000 dollars it is realistically one broad, cheap fund. The overlay sleeve is the part the liquidity read is allowed to move, and I would cap it at 20 to 30 percent of the account. On 5,000 dollars that is 1,000 to 1,500 dollars.
Then map states to that sleeve in advance. A high composite with confirming component reads means the sleeve is fully invested. A high composite with the component reads all neutral, which is exactly the screen above, means the sleeve sits at half. A composite in the bottom of its range means the sleeve is in cash and there are no new entries.
The point of capping the sleeve is not modesty. It is that a macro overlay running at 100 percent of a small account will, on its first wrong call, produce a drawdown large enough that you stop following the process. Every rule you abandon was correctly specified and incorrectly sized.
Where a small account quietly loses to costs
Four leaks, roughly in order of how much money they take from people.
- The spread, paid twice. On a thinly traded fund a wide bid to ask costs you on entry and again on exit. Check the spread as a percentage of price before you decide the instrument, not after you have decided the trade.
- Fractional versus whole units. If your broker does not support fractional trades, a 1,200 dollar target in an instrument priced at 340 dollars becomes three units and 180 dollars of unintended cash. Size to what you can actually buy.
- Turnover. A liquidity composite oscillating around a boundary will generate repeated small adjustments if you let it. This is what a tolerance band is for: require a meaningful move past your boundary before you act, and require a minimum interval between adjustments.
- Tax, in whatever form your account carries. A macro overlay is a turnover-generating machine, and short-holding-period turnover in a taxable account is expensive in a way that does not appear in the price you paid.
Add those up and you get the reason a small account should hold fewer, larger, longer positions than the internet suggests. Cost per decision is roughly fixed, so fewer decisions is a direct return improvement, entirely under your control.
The ticket you would actually place on Monday
Given the exact screen in the capture, here is a concrete workflow you can run in fifteen minutes.
Open the tab at a fixed time and write one line in a text file: date, composite, regime label, policy label, the three component reads, the signal tally, and the refresh stamp. Ninety seconds. That log is the only way you will ever know whether this process works for you, and it costs nothing to start.
Compare the state to your written map. On this screen, composite high but every component neutral and five of six signals neutral, my map says the overlay sleeve sits at half, so 500 to 750 dollars invested out of a 1,000 to 1,500 dollar sleeve.
If the current sleeve is already inside your tolerance band of that target, do nothing and close the tab. That is the outcome most weeks and it is a successful outcome, not a wasted session.
If it is outside the band, place one order in one instrument, sized in whole units, using a limit at or inside the current spread rather than a market order. Note the fill price in the same log line. Then set a calendar reminder for the same time next week and leave the position alone until then.
What makes this work is not the sophistication of the signal. It is that the decision was made against a written map, at a scheduled time, in a size you can hold, with the state recorded. A liquidity composite is a slow instrument. Trading it fast is the most reliable way to lose money with it.