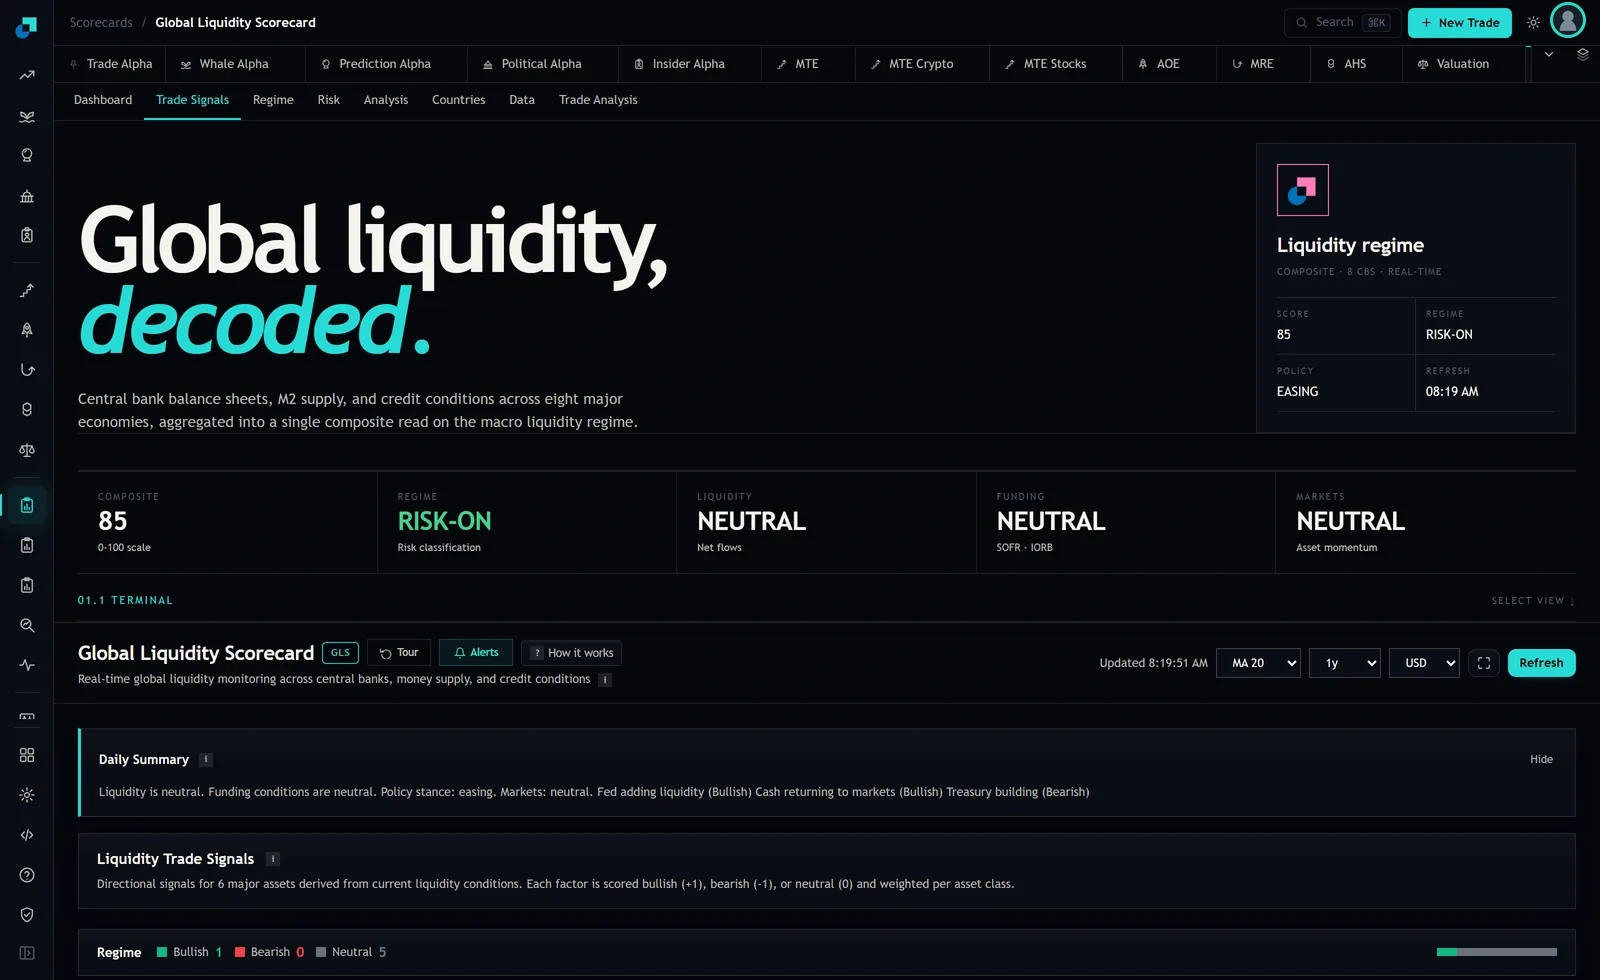
Before a macro read is allowed to change what I own, I want to know which condition produced it. Not the label on the tile, the condition underneath the label. The Global Liquidity Scorecard is showing a composite of 85 on a 0 to 100 scale, a regime read of RISK-ON, a policy read of EASING, and a refresh stamp of 08:05 AM. That is four pieces of information and only one of them is a number. This post is about where the number comes from, because a signal you cannot take apart is a signal you will abandon at the worst possible moment, usually two weeks after it starts costing you.
The eight balance sheets underneath one number
GLS names its inputs, which is more than most macro dashboards do. It tracks eight central banks: the US Federal Reserve, the European Central Bank, the Bank of Japan, the People's Bank of China, the Bank of England, the Swiss National Bank, the Bank of Canada and the Reserve Bank of Australia. The header tile compresses all of that into three words and a count, COMPOSITE, 8 CBS, REAL-TIME.
Eight is a defensible cut. Those institutions issue the currencies that fund almost everything a retail account can buy, and the four largest of them dominate the aggregate so heavily that adding a ninth central bank would move the composite less than a rounding difference in the Fed's weekly figure. Dropping the PBoC, on the other hand, would remove the largest source of variation that has nothing to do with Western policy cycles.
The balance sheets are not the only input. The module lists what else goes in:
- aggregate central bank balance sheet
- global M2 money supply
- USD liquidity indicators
- credit spreads
- the composite liquidity score itself
The inclusion of credit spreads is the part worth pausing on. Balance sheets and M2 measure the quantity of money. Credit spreads measure its price, and specifically the price of money to borrowers who are not governments. Those two can disagree for months. A central bank can be expanding while spreads widen, which is what a crisis looks like in its early innings, and a composite built only on quantity would keep flashing green through it. Having a price-of-credit term in the same score is what stops that.
How eight series become one number between 0 and 100
Aggregating eight balance sheets is not addition. Three problems have to be solved before a single figure exists, and knowing what they are tells you how to read the output.
The first is currency. The BoJ reports in yen and the PBoC in yuan. Translate both into dollars and a weakening dollar mechanically inflates the global aggregate without a single policy decision anywhere. Any serious construction has to decide whether it wants that effect included, because a dollar move is genuinely a liquidity event for anyone borrowing in dollars, or excluded, because it is not a policy action. Both answers are defensible and they produce different numbers.
The second is level against rate of change. A balance sheet that is enormous and shrinking is a different world from one that is smaller and growing. Markets tend to respond to the second derivative long before the first, so a composite that only reads levels will look calm while conditions deteriorate.
The third is normalisation. To land on a 0 to 100 scale, every input has to be scored against something, usually its own history. That is why a reading of 85 is a statement about where conditions sit relative to their own past, and not a probability. It does not mean an 85 percent chance of anything. Treat it as a percentile-flavoured index and you will read it correctly.
The module publishes its inputs and it publishes its output. In what I can see it does not publish the weights. That is normal for a composite index and it is not a scandal, but it does determine how you should use the thing. You are being handed an index, not an equation you can rebuild at home.
What the Trade Signals tab gives you and what it does not
Here is the part where I have to be straight with you. Trade Signals is one of several views inside GLS, sitting alongside Dashboard, Regime, Risk, Countries, Data and Trade Analysis. In the capture above, that tab shows the module header, the composite of 85, and the regime and policy labels. It does not show me a fired signal, a trigger threshold, or a control that turns the rule on and off.
So I am not going to tell you that a signal fires when the composite crosses some specific number, or that there is a setting on that tab which lets you change it. I do not know that, and a confident invented threshold is worse than an honest gap, because you would size a position against it. What I can do is tell you what the gap costs you and how to close it from your side of the screen.
The cost is this. When a macro signal changes state and you cannot name the input that moved, you have no way to judge whether the change is meaningful or mechanical. A composite drifting from 84 to 86 because the dollar sold off two percent is not the same event as a composite drifting from 84 to 86 because credit spreads compressed, even though the tile shows you the same thing in both cases.
Write the condition down before you need it
This is the part you can do this week and it takes about ninety seconds. Open GLS at a fixed time, the same day each week, and write one line in a plain text file: date, composite, regime label, policy label, refresh stamp. That is it. Six weeks of that and you own something the dashboard cannot give you, which is a history of what you actually saw at the time, uncontaminated by later revisions.
Then define your own condition against your own log, in advance and in writing. Mine looks like a sizing map rather than a trade trigger. On a 30,000 dollar account, a composite in the top band means I am willing to hold my full intended risk position, say 60 percent invested and 40 percent in cash. A middle band means 40 percent. A bottom band means 20 percent and no new entries. Those are numbers you choose based on what you can hold through a bad month, not numbers I should be choosing for you.
The reason to write it before the signal moves is entirely behavioural. A rule written on a quiet Sunday is a rule. A rule written while the composite is falling and your portfolio is down 9 percent is a rationalisation. The log is what lets you answer the only useful question afterwards: was this the condition I said I would act on, or did I move because I was uncomfortable?
Four places the chain can lie to you
Revisions come first. Central bank and monetary aggregate data get restated. A composite recomputed on restated inputs can show a past that never appeared on anyone's screen at the time, which is exactly how a backward-looking chart makes a rule look better than it was to trade.
Second, the word REAL-TIME on that tile is doing more work than the data behind it can support. The underlying releases arrive on weekly and monthly calendars. A refresh stamp of 08:05 AM tells you when the page last recomputed, not when a central bank last told the world anything. Most mornings the honest answer is that nothing new arrived.
Third, currency translation again, from the other side. If your positions are dollar-denominated, a composite that rises because the dollar fell is telling you something real about your funding conditions. If you are reading it as a policy indicator, the same move is noise. Same number, two meanings, and only you know which one you need.
Fourth and most important, there is no price in any of this. The composite reads conditions, not valuations. It cannot tell you that a risk-on regime is already fully in the price of what you were about to buy, and it will happily sit at 85 while an asset you like trades at a level that has already discounted every bit of that easing. Liquidity is the tide. It says nothing at all about what you paid for the boat.