Start with a correction, because it will save you from a bad assumption. The tier filter inside the Momentum Trading Engine is an access control. The engine's own documentation says strategies can be filtered by asset class and by tier, and it names those tiers as free, Plus and Premium. That is a statement about your subscription, not a quality grade. A Premium strategy is not a better strategy. It is a strategy you need a plan to see.
So if you want an A and a B rating on your shortlist, you have to grade them yourself. The good news is that the engine publishes enough per-strategy detail to do it properly, and the grading only takes a few minutes once you know which numbers carry weight and which are decoration.
The six numbers you can actually grade on
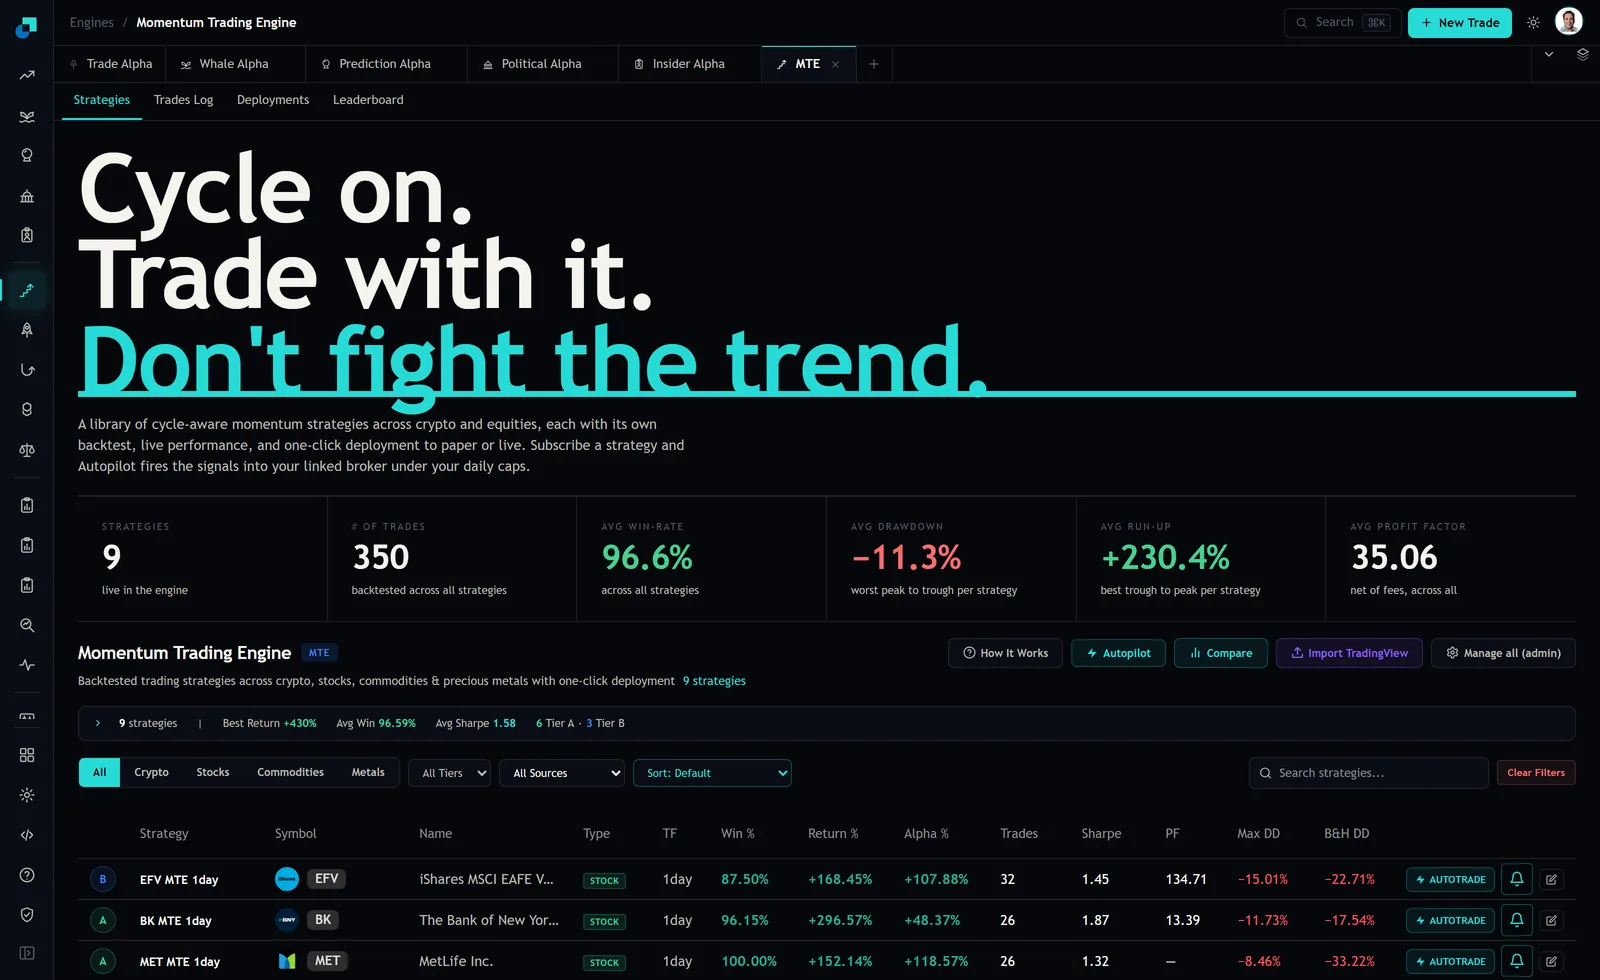
Across every tab, the engine holds six figures at the top of the page. At capture they read nine strategies live in the engine, 350 trades backtested across all strategies, an average win rate of 96.6 percent, an average drawdown of minus 11.3 percent described as worst peak to trough per strategy, an average run-up of plus 230.4 percent described as best trough to peak, and an average profit factor of 35.06 net of fees. The strategies tab adds a best return of plus 430 percent and an average Sharpe of 1.58.
Those are engine-wide averages, which makes them useless for choosing between two strategies but very useful as a baseline. Any strategy you are grading is either above or below each of those numbers, and knowing which side of the line it sits on is most of the work.
Trade count is the gate, not a tiebreaker
Grade this one first, because a strategy that fails it cannot be rated at all. The engine reports 350 backtested trades across nine strategies, which averages to roughly 39 trades each. That is a thin sample for judging anything.
The arithmetic is worth doing once so you feel it. With 39 trades, the standard error on a win rate estimate near 90 percent is about 5 percentage points, which means a strategy showing 90 percent has a plausible true rate anywhere from 80 to 100. The standard error on a Sharpe estimate over 39 observations, with a Sharpe near 1.6, is roughly 0.24. So a strategy showing 1.6 and one showing 1.2 are not distinguishable on the evidence in front of you. They just look different.
My rule is that a strategy with fewer than 30 closed trades cannot be graded A no matter what the other numbers say, and one with fewer than 15 does not go in the shortlist at all. This eliminates a surprising number of impressive-looking rows, which is the point.
A rubric that puts a strategy in A or B
Five checks. A strategy needs all five to be an A. Four makes it a B. Three or fewer and it is not worth your screen time.
- At least 30 closed trades in the backtest, so the other numbers mean something.
- Sharpe at or above the engine average of 1.58. Below that, you are picking a strategy that is worse than a coin flip against the library it sits in.
- Worst drawdown no worse than the engine average of minus 11.3 percent, or if it is worse, a return that is proportionally better. Twice the drawdown needs to buy you more than twice the return.
- Positive outperformance of the symbol's own buy and hold. The published configuration notes state this as a multiple, 19 times on one crypto configuration and 4 times on an equity one. If a strategy cannot beat holding the thing it trades, the rules are costing you money.
- Win rate that is not absurd. This one runs backwards to intuition. A strategy showing 99 percent is a flag, not a badge, because a win rate that high nearly always means exits that cut winners short and hold losers open.
The published configurations show the spread you are grading against. Two equity configurations on the same ticker carry 80 percent and 94 percent win rates with 17 percent and 20 percent drawdowns. Two crypto configurations carry 92 percent with a 15 percent drawdown and 99 percent with 16 percent. Under this rubric the 80 percent configuration is the least suspicious of the four, which is not where most people would have started.
What a B should change about your sizing
A tier rating is only useful if it changes an amount. If A and B strategies get the same position size, you have built a decoration rather than a process.
The way I run it is that a B gets half the size of an A, and the reason is not sentiment. A B usually fails on trade count or on Sharpe, and both of those failures mean the same thing, which is that the true performance could be materially worse than the displayed performance. Halving the size halves the cost of being wrong about that, and it leaves you positioned to add if the strategy accumulates live trades and holds up.
The practical version on a 10,000 dollar account. A strategies get 8 percent, so 800 dollars each. B strategies get 4 percent, so 400 dollars. Three A strategies and four B strategies puts 4,000 dollars to work and leaves the rest in cash, which will feel underinvested and is roughly correct for a library where the average strategy has 39 trades behind it.
Regrade on live trades, not on backtest rows
The grade you assign on day one is provisional, and the thing that should move it is live evidence. The engine's trade log distinguishes what actually happened from what was reconstructed. At capture it showed 357 trades, of which 44 rows carried an explicit banner saying they were reconstructed by replaying the strategy over historical candles, with no order placed and no fill occurring.
That distinction is the whole regrading mechanism. Reconstructed rows tell you what the rules would have done. Live rows tell you what they did, including the part where the fill was worse than the signal price. When you have twenty live trades on a strategy, run the same five checks again using only those rows. A strategy that graded A on the backtest and B on its live trades is telling you where the backtest was optimistic, and that gap is usually execution rather than logic. Size to the live grade, not the backtested one, and let the strategy earn its way back up.