Start with the honest limitation, because it changes what this article can be. The Whale Finder's Chain column holds one value per row. There is no entity identifier anywhere on the table, so the screen cannot show you one operator's behaviour side by side across Ethereum, Base, BSC and Solana. If you want that comparison you are building it yourself, and the platform is not confirming your join.
What the screen does support is the more useful version of the question. Given that a wallet's numbers are shaped by the chain it trades on, how should you read a small median clip or a low trade count before you conclude anything about the wallet itself?
Three rows, three chains, three different-looking traders
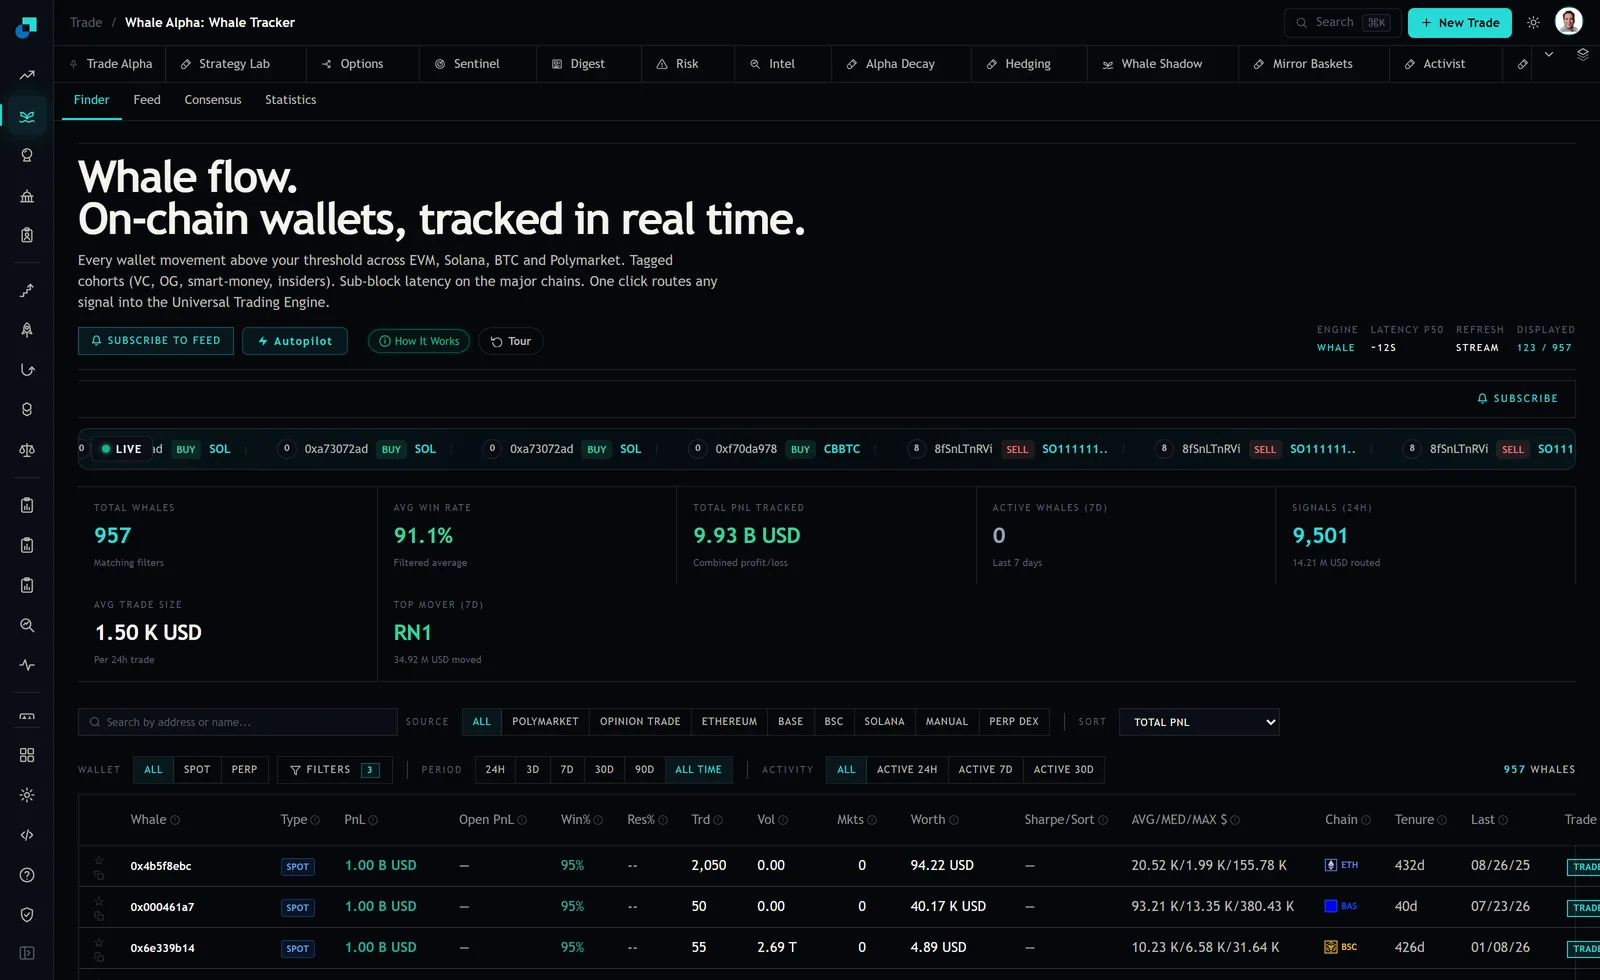
At capture the top three rows under a total PnL sort were on ETH, BASE and BSC. Read the behavioural columns rather than the PnL ones.
The Ethereum row showed 2,050 trades over 432 days of tenure, with average, median and maximum trade sizes of 20.52 thousand, 1.99 thousand and 155.78 thousand dollars. The Base row showed 50 trades over 40 days, at 93.21 thousand, 13.35 thousand and 380.43 thousand. The BSC row showed 55 trades over 426 days, at 10.23 thousand, 6.58 thousand and 31.64 thousand.
Divide trades by tenure and you get 4.7 trades a day on the Ethereum row, 1.25 on the Base row, and 0.13 on the BSC row. That is a 36-fold spread in activity. Compare medians and the Base wallet's typical trade is 6.7 times the Ethereum wallet's. If those three rows were one operator, you would be looking at somebody who trades constantly in small size in one place and rarely in large size in another, and you would be tempted to call the large rare trades conviction.
Why the chain sets a floor under clip size
The mechanism is fee arithmetic and it is not subtle. Every trade carries a cost that does not scale with size: network fees, and on most venues a fixed component of the spread you cross. That fixed cost divided by your trade size is the drag, and it decides how small a trade can be before it stops being worth doing.
Work it with round numbers. If a round trip costs 20 dollars in fixed terms, a 2 thousand dollar clip pays 100 basis points before anything else happens, and a 13 thousand dollar clip pays 15. If the same round trip costs 20 cents, the 2 thousand dollar clip pays 1 basis point and the constraint disappears entirely. A wallet on an expensive chain is pushed toward fewer, larger trades not because it is more certain but because the alternative loses money to fees.
Block time layers on top. A chain that settles in sub-second intervals allows a wallet to split an order into many pieces and react between them. A chain with slower settlement makes each decision more expensive in time as well as money, which pushes the same operator toward committing in one go.
I want to be careful about how strongly to state this. Three rows on one screen is an anecdote, and the differences above are consistent with the fee explanation without proving it. The rows are also three different wallets with three different strategies, so nothing here isolates the chain effect. The mechanism is real; the evidence on this screen is illustrative.
The check you can actually run
The Finder gives you the tools to test it properly rather than take my word for it, and it takes about ten minutes.
- Set the source filter to ETHEREUM, set the period to 30D so every wallet is measured over the same window, and note the median column across the first page of rows. Then repeat for BASE, BSC and SOLANA in turn.
- Compare medians, not averages. The average is dragged around by a single large trade, and the gap between average and median on those three capture rows was 10x, 7x and 1.6x, so the average is describing outliers on two of the three.
- Compare trades per day rather than raw trade counts, because tenure varies enormously. At capture the tenures on those three rows were 432, 40 and 426 days, and the raw Trd figures are meaningless until you divide.
If the medians line up in the order you would predict from fee levels, you have a chain effect worth adjusting for. If they do not, you have learned that the wallets on each chain differ for other reasons, which is equally useful and stops you applying a correction that does not exist.
Where Solana sits in this, and what the screen shows
The source strip includes a SOLANA tab, and Solana wallets were plainly active at capture, but they were not in the top three rows of the default sort. Where they showed up was the live strip above the table, with base58 handles rather than hex addresses, running buys and sells against SOL and a wrapped SOL contract.
That address format difference is worth noticing for a practical reason. It means any list you keep of wallets to watch will have two shapes of identifier in it, and if you are tracking what you think is one operator across chains, nothing about the strings will help you. On the EVM side you at least have a common address format across Ethereum, Base and BSC, which is why cross-chain claims tend to be made about those three and go quiet about Solana.
The adjustment to make before you compare two wallets
The mistake this all guards against is a specific one. You find a wallet with a large median clip and low frequency, and you rate it as high conviction and low noise. Then you find one with a small median and high frequency and you rate it as a churner. If those two wallets are on chains with different cost structures, you have ranked them on their fee environment and written conviction on the label.
So rank within chain first. Pick the source tab, look at the distribution of medians on that tab, and ask where your candidate sits relative to its own neighbourhood. A 13 thousand dollar median might be unremarkable on an expensive chain and enormous on a cheap one, and only the within-chain comparison tells you which.
Then, when you do compare across chains, compare shape rather than level. The ratio of maximum to median survives the translation better than either number alone: 78x on the Ethereum row, 28x on the Base row, 4.8x on the BSC row. A wallet whose largest trade is five times its median is running a consistent size discipline wherever it trades. One whose largest is eighty times its median has a habit and an occasional lunge, and the lunge is the part you would be copying.