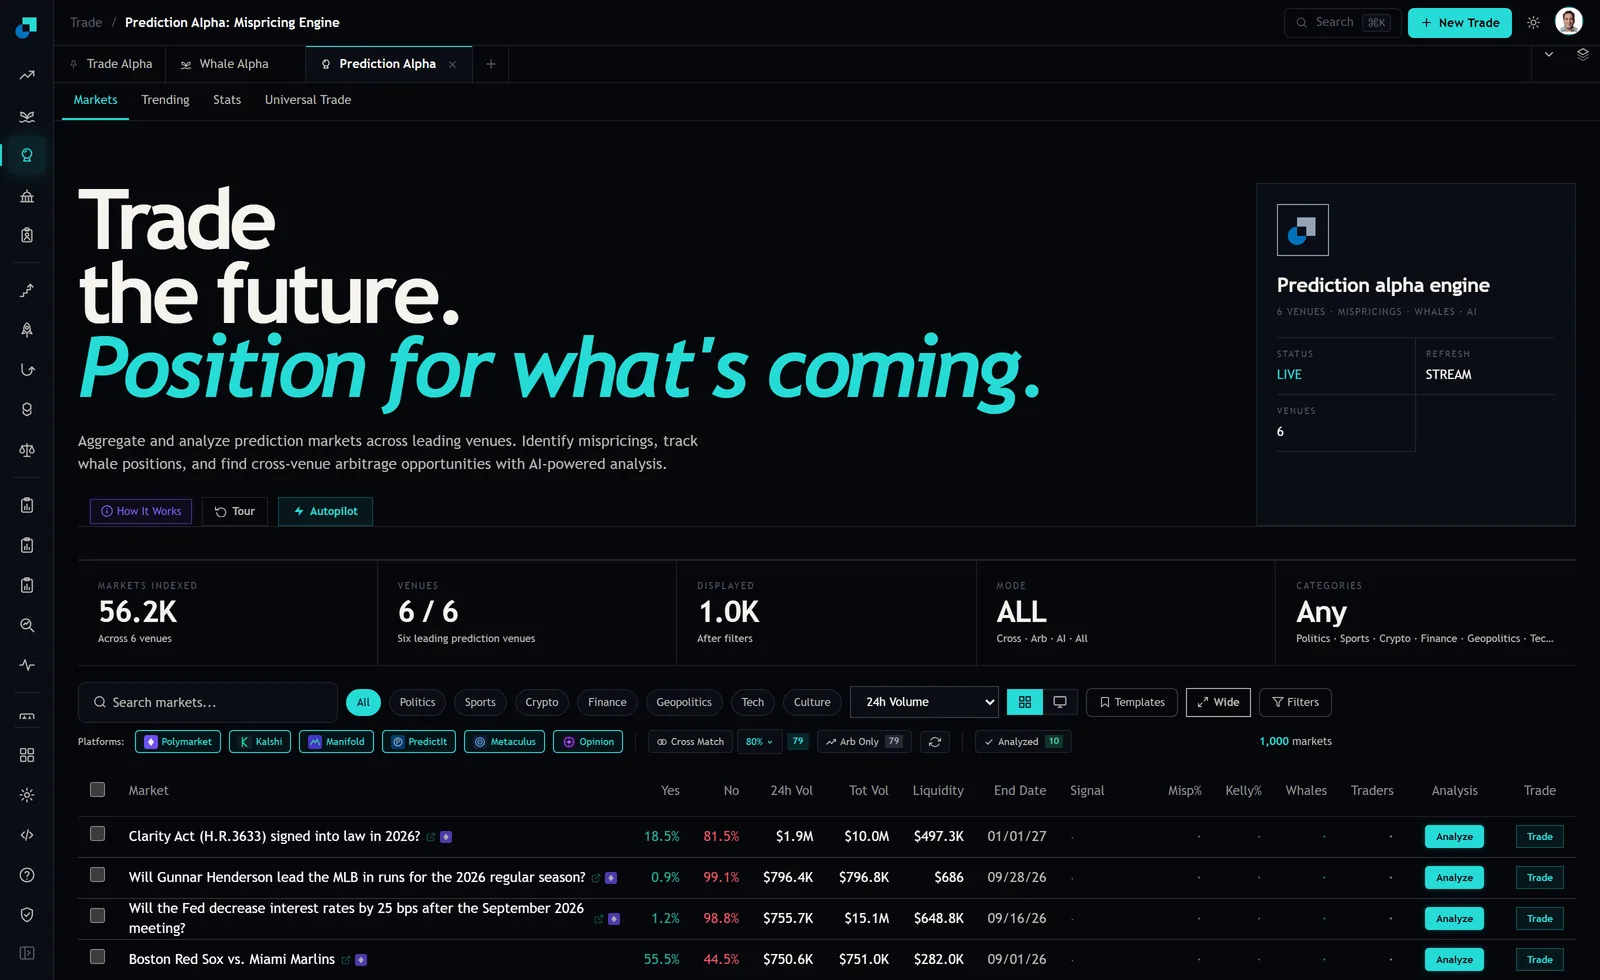
Two columns sit next to each other at the right hand end of the Prediction Alpha markets table, labelled Whales and Traders. On their own neither is worth much. A market with nine whales is not better than a market with two, and a market with four hundred traders is not automatically wiser than one with forty.
Read them as a ratio and they answer a question that changes what you actually do: is this quoted price a crowd estimate, or is it one account's opinion with a few others standing near it. Those are different products. You would pay a different amount for each, and you would plan your exit differently, and the number on the screen looks identical either way.
What the two columns are counting
Traders is a participant count for the market. Whales is a count of participants large enough to be flagged as such, which on this platform is tied to a wallet identification effort rather than to a self declared account size. The analyst leaderboard elsewhere in Blockcircle reports 26,687 identified wallets, so the whale label is drawn from a maintained list rather than computed fresh from each order.
That matters for how you read a blank or a low number. A whale count of zero can mean no large account is in this market, or it can mean the large accounts in it are not on the list. Both are plausible and the column cannot distinguish them for you. Treat the count as a lower bound on concentration, never as a ceiling.
The module also carries a whale position overlay, which is the more useful artefact once you are actually interested in a market, because a count tells you how many large accounts are present and the overlay tells you which side they are on. Ten whales evenly split is a different market from ten whales all long, and the count alone reads the same in both cases.
Three shapes, and what each one does to your entry
Many traders, few whales. This is the closest thing to a crowd price. A lot of small opinions have been aggregated and the result is usually well behaved, which is precisely why fading it needs a reason beyond disagreement. If you cannot name the specific thing you know that four hundred people do not, you are paying a spread to hold the consensus view.
Few traders, one or two whales. The quote is somebody's position, not the market's estimate. The number on the screen was placed by an account whose size means they set it rather than found it. Two consequences follow. First, your read is now partly a read on that account, and you have no idea who they are or what their thesis is. Second, and more practically, the account that made your entry price is the same account that will be on the other side of your exit, and they will know you need to trade before you do.
Many traders and many whales. Contested, and usually the healthiest book on the page. The uncomfortable part is that this is also where the price is closest to fair, because a lot of capable capital has already argued about it. Good books and good prices tend to be the same markets, which is not a coincidence and is not going to stop being true.
The reading that survives a blank cell
Here is the honest limitation. On the capture above, both columns hold placeholder dots on every row, and the filter bar shows an Analyzed chip reading 10 against 1,000 markets displayed and 56.2K markets indexed across six venues. So the derived half of the row is empty far more often than it is full, and I cannot tell you from the screen alone whether those counts populate on demand when you press Analyze or whether coverage is simply thin. It matters which, and the practical rule is the same either way: if the cells are blank on the row you care about, you do not have a concentration reading on that market, and you should not act as though you do.
Fortunately there is a substitute reading that uses only columns which are always populated. Compare 24 hour volume against total volume. On the four rows in the screenshot: the Clarity Act market traded 1.9M in a day against 10.0M lifetime, so roughly a fifth. The Fed rate market traded 755.7K against 15.1M lifetime, which is five percent. Then the other two. The Gunnar Henderson market shows 796.4K of 24 hour volume against 796.8K total, and the Red Sox against Marlins market shows 750.6K against 751.0K.
Those last two are effectively one hundred percent. Every dollar that has ever traded in those markets traded in the last day. That is a market with no history, either because it was listed yesterday or because it is a single session event that exists only on the day it resolves. You have learned something real about participation without either concentration column being populated: there has been no time for a crowd to form.
Concentration decides your exit, not your thesis
The reason to care about any of this is that a binary is a fixed payoff and your realistic exit is a sale to somebody else rather than a run to resolution. Check the Liquidity column against the ratio and the two together tell you the whole story.
The Red Sox market shows 282.0K of resting liquidity at a 55.5 against 44.5 quote. Even if the participant base turns out to be narrow, that book will take a retail sized order out without complaint. The Henderson market shows 686 dollars of resting liquidity at 0.9 against 99.1. If that market has one whale in it, that whale is the book, and a 250 dollar exit is more than a third of everything resting. The concentration reading and the depth reading are the same reading arriving through two columns, and when they disagree you should believe the smaller number.
This is also why a high whale count is not automatically comforting. Large accounts in a thin market have the same exit problem you do, which means their exit and your exit are the same trade in the same direction at the same time. Concentration is not just a question of who set the price. It is a question of who is going to want out of it alongside you.
The habit to build this week
Before any entry, take thirty seconds and write four numbers on the row you are considering: liquidity, 24 hour volume, total volume, and the whale and trader counts if they exist. Then answer two questions out loud. Has this market existed long enough for a price to mean anything, which is the 24 hour against total comparison. And can it absorb both halves of my trade, which is the ticket against liquidity comparison.
If the concentration columns are blank, do not go looking for a row where they happen to be filled. That filter selects for markets somebody else has already looked at, which is a different property from markets worth trading. Press Analyze on the two or three questions you actually have a view on and let the rest stay empty. The blank cell was never a bearish signal. It was a statement about the queue, and the queue is not something you should be trading against.