Six numbers run across the top of the Political Alpha dashboard, just under the hero block and just above the live filing ticker. They look like one coherent readout. They are not. They are six counters measured over at least four different windows, two of which are cumulative archive totals that will never move in a way that matters to you, and two of which are the only ones worth glancing at on a Monday. Read a cumulative number as news and you will feel informed while learning nothing.
What follows is the strip as it read on my capture, left to right, plus the second row of tiles underneath it, and what each one is actually counting.
The first two tiles are inventory, not activity
The leftmost tile reads 696,750 under the label TRADES INDEXED, with the subtitle "STOCK Act + intl PDMR". That is the whole archive. Every disclosed transaction the platform has ever ingested, back to whenever ingestion started, across US congressional filings and the international equivalents. It goes up every day and it never goes down. Watching it is like watching an odometer.
Next to it, LEGISLATORS reads 7,083, subtitled Senate, House, Lords and MPs. Same character. It is the size of the covered universe, not the number of people who traded recently. Note that 7,083 is a much bigger number than the count of sitting legislators in any one country, because the universe spans the coverage list, and because, as the Leaderboard makes plain, the population includes judicial filers alongside legislators. That matters the moment you start dividing one header number by another.
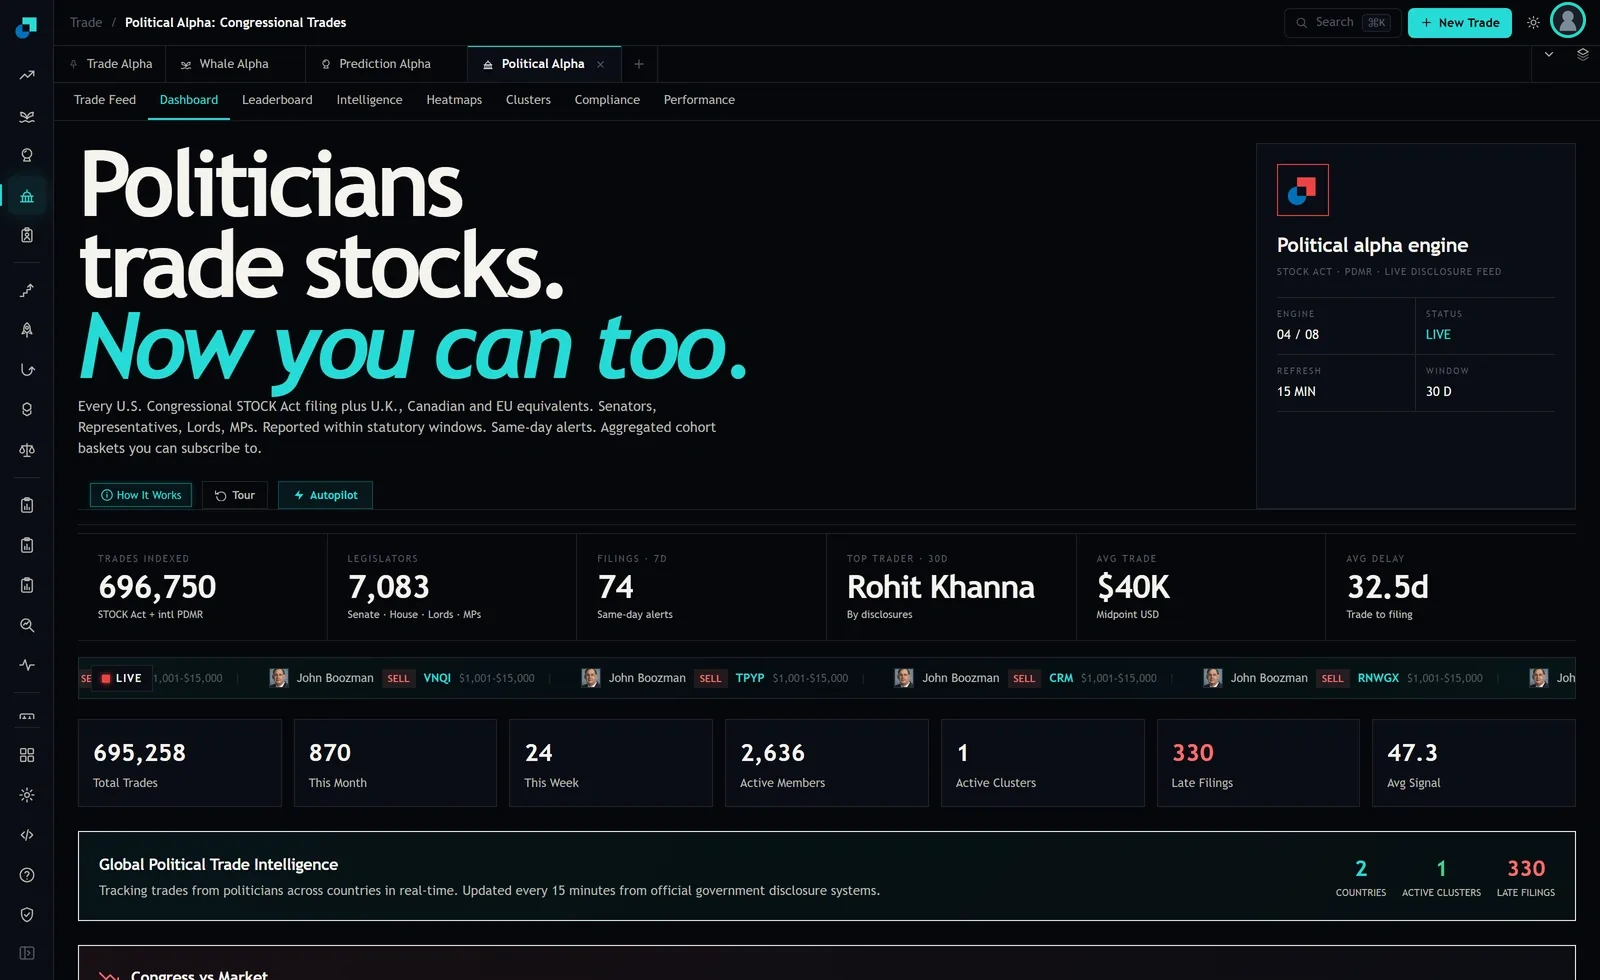
That gap is the first thing I would point at. The header claims 696,750 indexed trades. The tile row directly below it, in the same viewport, says 695,258 total trades. They differ by roughly 1,500. I do not know which inclusion rule differs, and the dashboard does not say. What I take from it is a rule of thumb worth carrying into every module on the platform: when two counters of nominally the same thing disagree, they are answering slightly different questions, and the honest move is to pick one, note which one you picked, and stop treating either as the truth.
The two counters that genuinely move week to week
FILINGS 7D reads 74, subtitled "Same-day alerts". This is a rolling seven-day window and it is the one number on the strip that tells you whether the week was busy. Underneath, the tile row gives you This Month at 870 and This Week at 24.
Notice that 74 and 24 do not agree, and they are not supposed to. A rolling seven days and a tile labelled This Week are different windows the instant the calendar week is younger than seven days, and a filing is not the same unit as a trade in the first place. So use them for what each is good for. The 7D counter is your activity pulse. The This Month number, set against 870, tells you whether the current stretch is running hot or quiet relative to the last few weeks, provided you write it down every Monday and build your own baseline. Nothing on this page gives you that baseline. You have to keep it yourself, in a notebook, four numbers a week.
The tile row also carries Late Filings at 330 and Active Members at 2,636. Active Members is the count of people with activity in the window rather than the whole 7,083 universe, which is the more useful denominator when you want to know how concentrated the week's flow was.
Average trade is a midpoint of a bracket, not a dollar amount
AVG TRADE reads $40K, and the subtitle does the important work: "Midpoint USD". Congressional disclosure reports transaction size in brackets, not exact amounts. Look at the live ticker running under the header on the same screen and you will see the point immediately. Four consecutive sell rows, four different tickers, and every single one carries the same size string of $1,001 to $15,000, because that is the smallest bracket and an enormous share of disclosed activity falls inside it.
The midpoint of that bracket is about $8,000. So a platform-wide average of $40,000 is not telling you that a typical disclosed trade is forty grand. It is telling you that the average of the bracket midpoints, across a distribution where the mode is the bottom bracket and the tail runs into the millions, comes out at forty grand. The tail is doing the work.
The practical consequence for anyone with a five-figure account is blunt. Never size a position off a disclosed dollar figure, because there is no disclosed dollar figure. A member reporting the bottom bracket might have bought $1,100 of something or $14,900 of it, and those are different levels of interest. Bracket data supports questions about direction, frequency and clustering. It does not support questions about conviction measured in dollars.
The delay number is the one that should change your behaviour
AVG DELAY reads 32.5d, subtitled "Trade to filing". That is the average gap between a transaction happening and the disclosure of it appearing. Just over a month.
This single number reframes the entire module. Whatever you see in the feed today, on average, happened about a month ago. The price you can buy at is not the price the filer transacted at, and a month is long enough for a full earnings cycle to have landed in between. Set against Late Filings at 330, the distribution clearly has a long right tail, so plenty of individual rows are far staler than the average.
What that buys you is a discipline. A filing is a research prompt, not an entry signal. When one catches your eye, the first thing to do is pull the price chart for the disclosure window and ask whether the move already happened. If it did, the interesting question is not whether to chase, it is whether the thesis that motivated the trade is still live at today's price. Frequently it is not, and the correct action is to close the tab.
The two tiles you cannot read cold
Two readings on this page I would not quote to anyone until I had watched them for a few weeks. Avg Signal reads 47.3, and the tile does not state a scale. The module documents a per-trade signal score that weights politician history, committee fit, size and timing, but without a stated range 47.3 is only meaningful as a relative reading against its own history. Write it down weekly and it becomes useful. Quote it as an absolute and you are guessing.
Active Clusters reads 1, and the Global Political Trade Intelligence strip below repeats it alongside Countries at 2 and Late Filings at 330. Countries at 2 sits against a coverage list that names eighteen. The reading I would default to is that the tile counts countries with activity inside the current window rather than countries covered, which would make a single active cluster and two active countries a description of a quiet week rather than a description of the product. But the tile does not say that, so treat it as an open question rather than a fact you repeat.
The Monday routine that comes out of all this is short. Four numbers into a notebook: filings over seven days, trades this week, late filings, average signal. Nothing else on the strip changes fast enough to be worth your attention, and after a month of entries you will have the baseline the dashboard does not give you.