The intuition is reasonable. If a venue is preparing to list a token, somebody knows before the announcement, and the people who know tend to buy. Holder counts and pool depth should therefore accelerate ahead of the news, and a desk watching those two series should be able to see the listing coming.
Reasonable is not measured. This piece is about what it takes to turn that intuition into a number you would put in front of a risk committee, and about the two places where the exercise usually dies. Neither of them is the statistics.
The signal does not exist yet, and that is the first problem
Look at what the launches ledger actually presents. The columns are Token, Chain, MCap, Volume, Liquidity, Holders, Score, Safety, Date, DEX and Trade. Every one of those is a level as of the moment you loaded the page. The header on my capture read 100 of 3,771 displayed across 9 of 9 chains, and the filters above the table set a minimum market cap, a minimum volume and a minimum holders count.
There is no acceleration field, no growth rate, no history and no as-of parameter. So the object your hypothesis is about, the second derivative of holder count and of pool depth, does not appear anywhere in the module. It has to be constructed by you, out of repeated snapshots, and until you have been taking them the study cannot start.
That has a hard consequence for scheduling. The first useful measurement date is a fixed interval after the day you build the capture job, not the day you decide the question is interesting. Desks routinely lose a quarter by discovering this at the analysis stage rather than at the planning stage.
Snapshot design matters more than it looks. Capture the full accessible universe rather than the displayed page, because the top 100 by any sort is a moving selection and differencing two moving selections produces changes that are artefacts of the sort. Stamp every snapshot with the capture time, store rows append-only, and never overwrite a prior observation with a later value for the same token.
What a single row can and cannot support
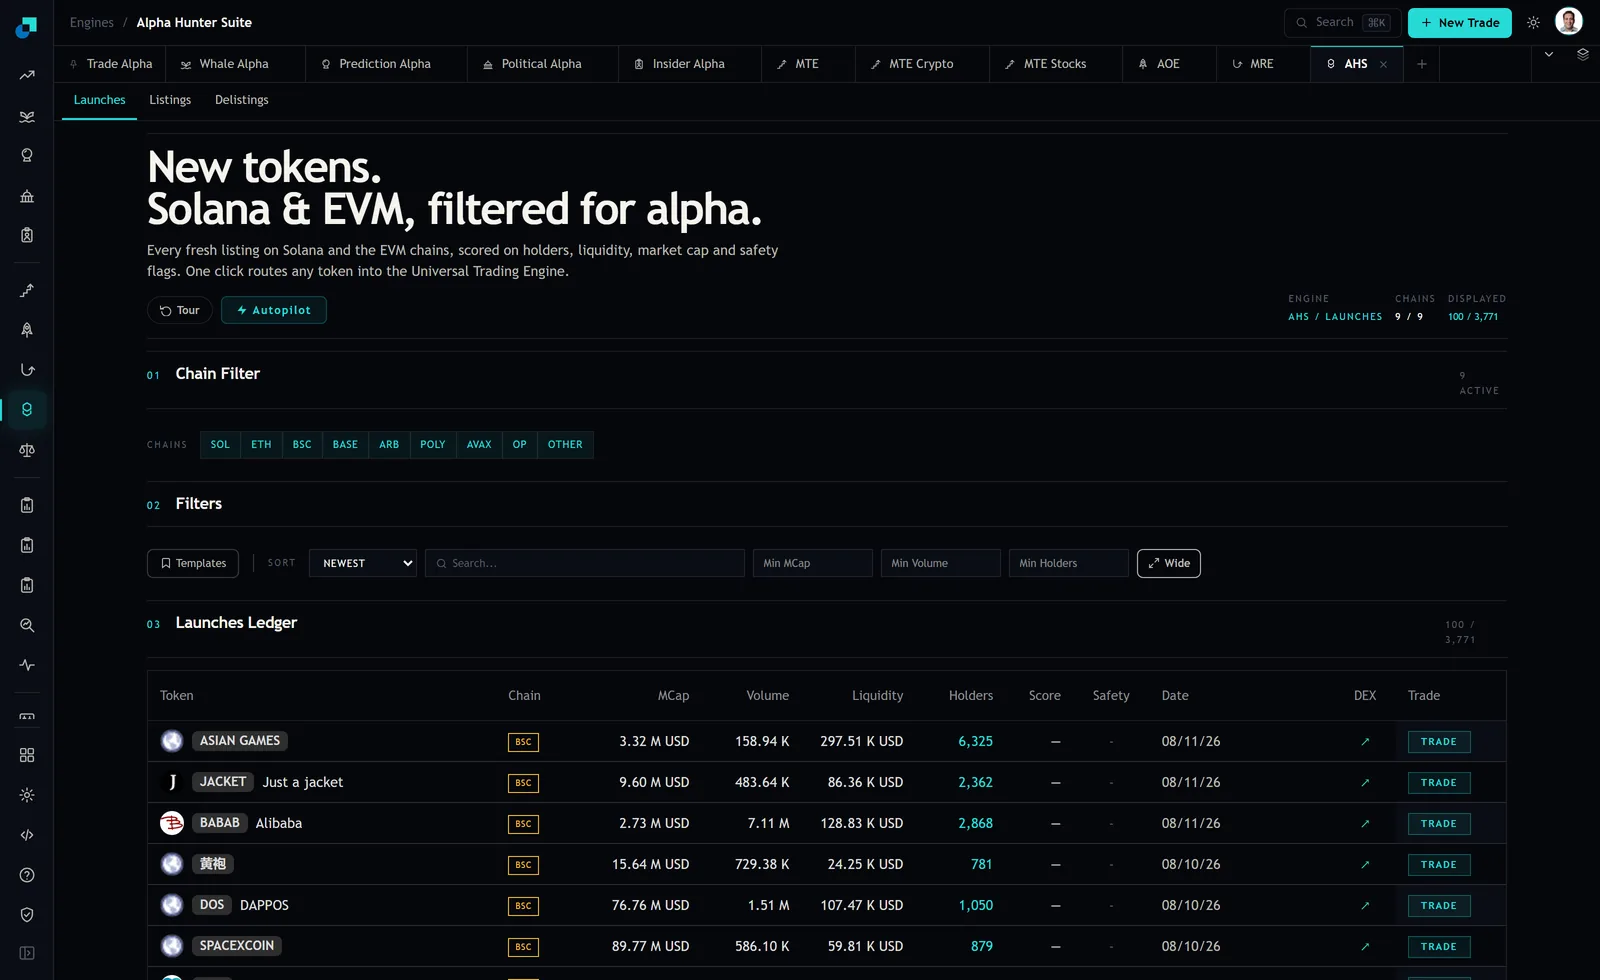
Three readings from that capture are worth carrying into the design.
The levels are small. Liquidity across the visible rows ran from about 24 thousand dollars to about 298 thousand. That is the pool a signal would be asking you to trade into, and I will come back to it because it is the constraint that ends most of these projects.
The market cap to liquidity relationship is unstable across rows. DAPPOS showed 76.76 M in market cap against 107.47 K of liquidity, while ASIAN GAMES showed 3.32 M against 297.51 K. If your acceleration measure is denominated in dollars rather than in units of the token's own depth, you will rank these incomparably.
The Score and Safety columns were blank on every visible row at capture. Do not build a feature on a field you have not confirmed is populated for your universe. Check the fill rate first, in your own snapshots, before it becomes a term in a model.
The event definition, and the two clocks
A leading indicator study needs an event with a timestamp, and the timestamp is where these go wrong.
Define the event as the first listing announcement for that token at a venue in your defined set. Then be explicit about which clock you are aligning to. There is the announcement time, which is what the venue published and when. There is the ingest time, which is when the event reached you. And there is the effective time, when the book actually opened. Aligning your pre-event window to the wrong one shifts your entire measurement window by hours or days, and since you are looking for a lead of exactly that magnitude, the error can create the whole result.
The pre-event window has to be fixed in advance too. Pick it, write it down, and do not tune it. If you test a seven day lead, a fourteen day lead and a thirty day lead and report the best one, you have three tests and a multiple comparisons problem, and the honest report includes all three.
The control is the rest of the universe on the same dates. Every token that showed comparable acceleration and was never announced is a false positive, and it is the only way to get a denominator. A study that only looks at tokens which were eventually listed and finds that they accelerated first has established nothing, because it has not looked at the tokens which accelerated and went nowhere.
Reporting precision honestly when the base rate is tiny
Here is the arithmetic that decides whether this is usable, and it is worth walking through with an assumed base rate so the shape is visible. These are illustrative figures chosen to show the mechanism, not measurements.
Suppose that in any given month, one token in five hundred in your universe receives an announcement from a venue in your set. Suppose your acceleration filter catches eight out of ten of those, which would be a genuinely strong detector, and suppose it fires on two percent of the tokens that are not announced.
Out of five thousand tokens, ten are announced and your filter catches eight of them. The other four thousand nine hundred and ninety produce roughly one hundred false alarms. So your alert list is about one hundred and eight names of which eight are real, and the precision is around seven percent. The detector is excellent and the list is still ninety three percent noise, purely because the base rate is low.
That is not a reason to abandon the signal. It is a reason to report it as precision at a stated alert volume rather than as a hit rate, and to design the downstream process for a list that is mostly wrong. If your reaction to an alert is an expensive discretionary review, one hundred alerts a month will consume the desk. If your reaction is a small, pre-sized, systematically stopped position, the economics can work even at seven percent, provided the winners are large enough relative to the losers. That ratio, not the hit rate, is the number to compute.
The size at which it stops paying
Now the constraint that ends most versions of this project.
Take the liquidity figures off the capture. A pool holding on the order of one hundred thousand dollars supports a position, at a defensible participation rate and without moving the price against yourself on entry and exit, of a few thousand dollars. Multiply that by an alert list of one hundred names and the entire strategy is deploying a few hundred thousand dollars of gross exposure at best, and it is doing so across the most operationally intensive assets on your platform.
For a desk with a meaningful book, that is not a strategy, it is a research cost. And notice that it cannot be scaled by taking a larger share of each pool, because your own entry is then the depth acceleration you claim to be detecting, which contaminates the signal for everyone including you.
So compute the capacity first. Take the median liquidity of the names your filter selects, apply the participation rate your execution policy allows, multiply by the expected number of concurrent positions, and compare that number against the minimum allocation the desk would bother running. If the capacity comes in below that threshold, the correct decision is to stop before building the snapshot infrastructure, and it is a much cheaper decision to make in week one than in month six.