A sector flow chart in raw dollars is a chart of who has the most money to spend. That is a real quantity and it is worth knowing, but it is not the quantity most desks think they are reading when they use one of these panels to set a tilt. The correction is a denominator, and the choice of denominator is a discretionary decision that changes the ranking, which means it belongs in the method document rather than in someone's head.
Raw flow ranks balance sheets, not breadth
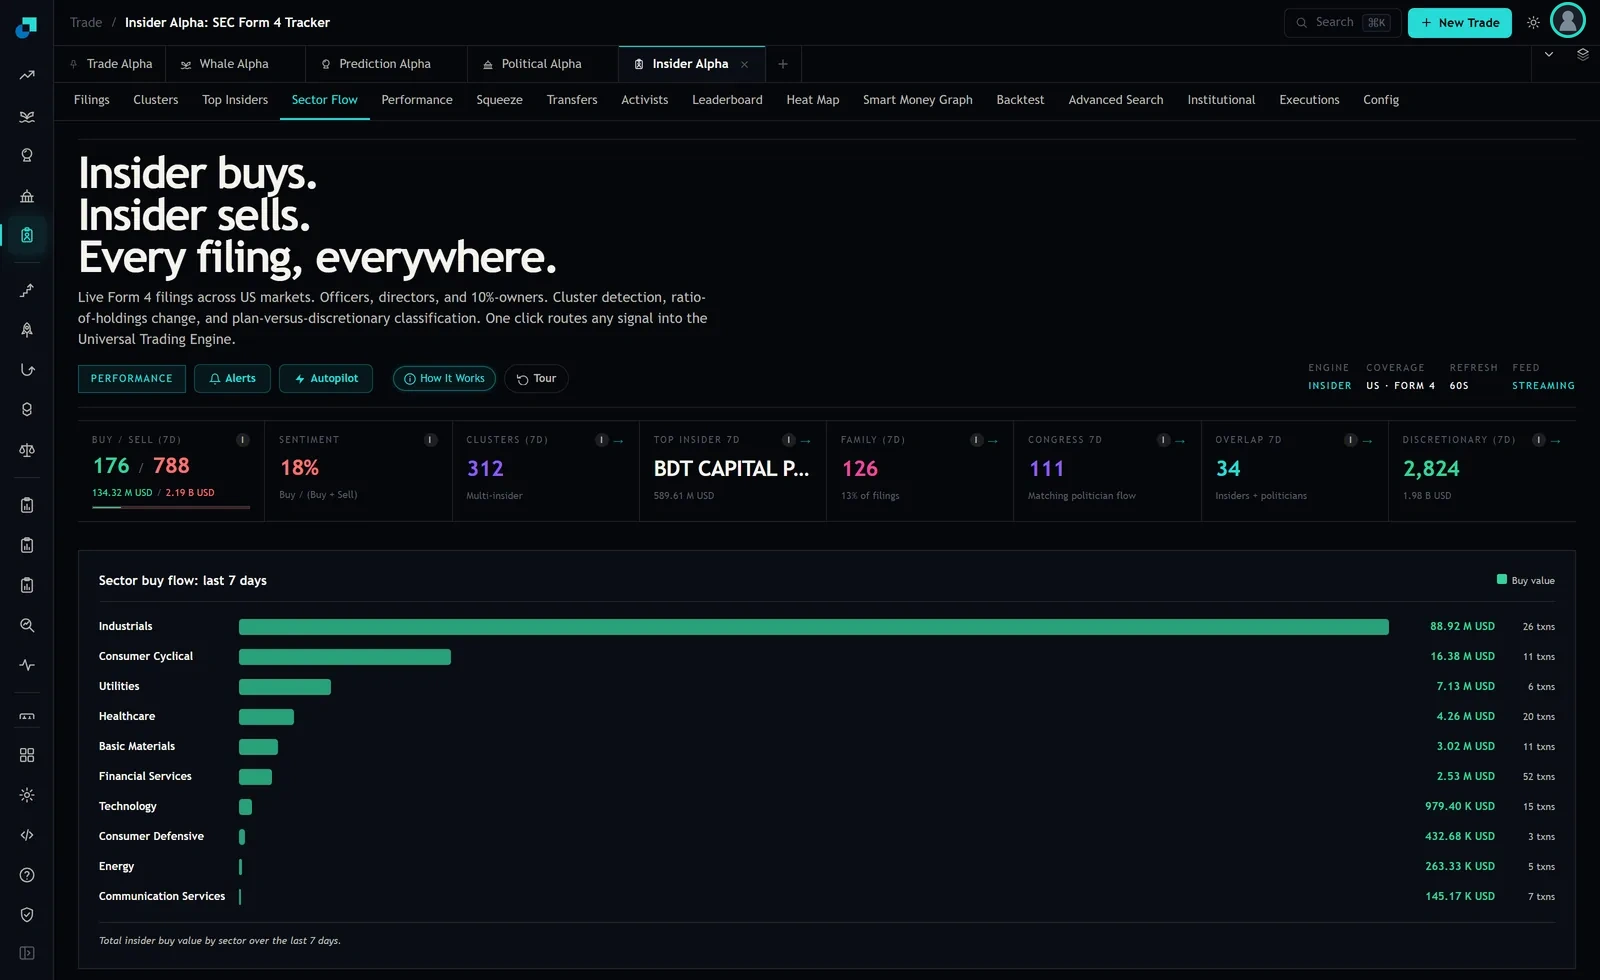
The captured Sector Flow panel gives both numerator and one usable denominator, so the problem is visible without leaving the screen. The rows read as follows. Industrials, 88.92 M USD across 26 transactions. Consumer Cyclical, 16.38 M USD across 11. Utilities, 7.13 M USD across 6. Healthcare, 4.26 M USD across 20. Basic Materials, 3.02 M USD across 11. Financial Services, 2.53 M USD across 52. Technology, 979.40 K USD across 15. Consumer Defensive, 432.68 K USD across 3. Energy, 263.33 K USD across 5. Communication Services, 145.17 K USD across 7.
Those ten rows sum to roughly 124.1 million dollars across 156 transactions. Industrials is about 72 percent of the dollars from about 17 percent of the transactions. Financial Services is about 33 percent of the transactions from about 2 percent of the dollars. A tilt built on the raw bars is a tilt toward wherever the largest single cheques happened to land in a seven day window, and with an average ticket of about 3.4 million dollars in Industrials against about 49 thousand in Financial Services, those two rows are not measuring the same behaviour at all.
Two normalisers and what each one reorders
The first is per-transaction value, which the panel supports directly since it publishes both columns. Dividing gives Industrials about 3.4 million, Consumer Cyclical about 1.5 million, Utilities about 1.2 million, Basic Materials about 275 thousand, Healthcare about 213 thousand, Consumer Defensive about 144 thousand, Technology about 65 thousand, Energy about 53 thousand, Financial Services about 49 thousand and Communication Services about 21 thousand.
The reordering is modest but instructive. Financial Services falls from sixth on dollars to ninth on average ticket. Consumer Defensive rises from eighth to sixth. Basic Materials passes Healthcare. Industrials still leads, which tells you something real: its dominance is not purely a single-cheque artefact, since its average transaction is also the largest.
The second normaliser is breadth, meaning the transaction count itself expressed as a share of the sector's filer population rather than as a raw count. This is where the panel stops helping, and the distinction matters more than it looks. Fifty-two transactions is not fifty-two people. A single filer buying six times contributes six. Without distinct filer counts you cannot separate broad participation from one active buyer, and broad participation is the property that most of the insider literature treats as carrying signal.
Float normalisation and the denominator you have to build
The float normaliser expresses insider purchases as a fraction of the sector's tradable shares or market capitalisation, so that a two million dollar purchase in a small-cap sector is not swamped by a fifty million dollar purchase in a large one. The panel does not expose float, so this join is yours to build, and three choices inside it decide your answer.
Free float against shares outstanding is the first, and for exactly this application it is the consequential one, because insider-heavy companies are precisely the ones where the two diverge most. Second is aggregation: a sector float total is dominated by its largest constituents, so a purchase in a small member of a mega-cap sector will normalise to nearly nothing regardless of how meaningful it was at the company level. Normalising at the company level and then aggregating the normalised values is a different and usually more informative construction. Third is the point-in-time question, since float changes with issuance and buybacks and a current-float join applied to historical filings is a look-ahead error.
One thing worth stating plainly. The usual argument for float normalisation is that real estate and mega-cap technology otherwise sit permanently at the top of a raw dollar ranking. On the board I captured that pattern was not present. Technology was seventh of ten by dollars at 979.40 K USD, and no real estate row appeared on the panel at all, which is itself a taxonomy fact worth checking before you build anything on top of it. The normalisation is still the right construction, but adopt it because you have verified the distortion on your own window and universe, not because the argument sounds right.
Reconstructing the population counts the panel does not give you
To get distinct filers per sector you have to go back to the filing level rather than the roll-up. The practical shape of that job is worth anticipating.
- Key on the filer's central index key rather than the displayed name. Name strings on these boards appear in inconsistent case and format, and both false merges and false splits are common when joining on them.
- Decide how to treat entity filers separately from officers and directors. A fund filing as a ten percent owner is a different population from the company's management, and pooling them makes the breadth measure meaningless.
- Decide whether the denominator is the number of filers who bought or the number of filers who could have. The second is far more informative and far more work, since it requires the full roster of Section 16 filers per company.
- Fix the window. The panel is a rolling seven days. A per-filer measure computed over seven days will be dominated by whether a company happened to have an open trading window, which is a calendar artefact rather than a signal.
Documenting the denominator so the tilt is defensible
Normalisation is the step where a reviewer will ask why this and not that, and the honest answer is usually that several defensible choices existed. That is fine as long as the choice was made in advance and only once.
Log the denominator definition and the date it was last changed. A normaliser that has been revised three times in a year is a tuning process, and it will produce a tilt that fits the recent past whether or not anyone intended it. Publish the raw board alongside the normalised one in whatever the desk reads, so that the size of the adjustment is visible rather than buried. Record the coverage gap: on this capture the ten sector rows accounted for about 124.1 million dollars against a headline buy figure of 134.32 M USD and 156 transactions against 176 buys, so roughly one transaction in nine was outside the sector breakdown. Whether that residual is random or systematic is a question your normalisation cannot answer and your documentation should not pretend to.