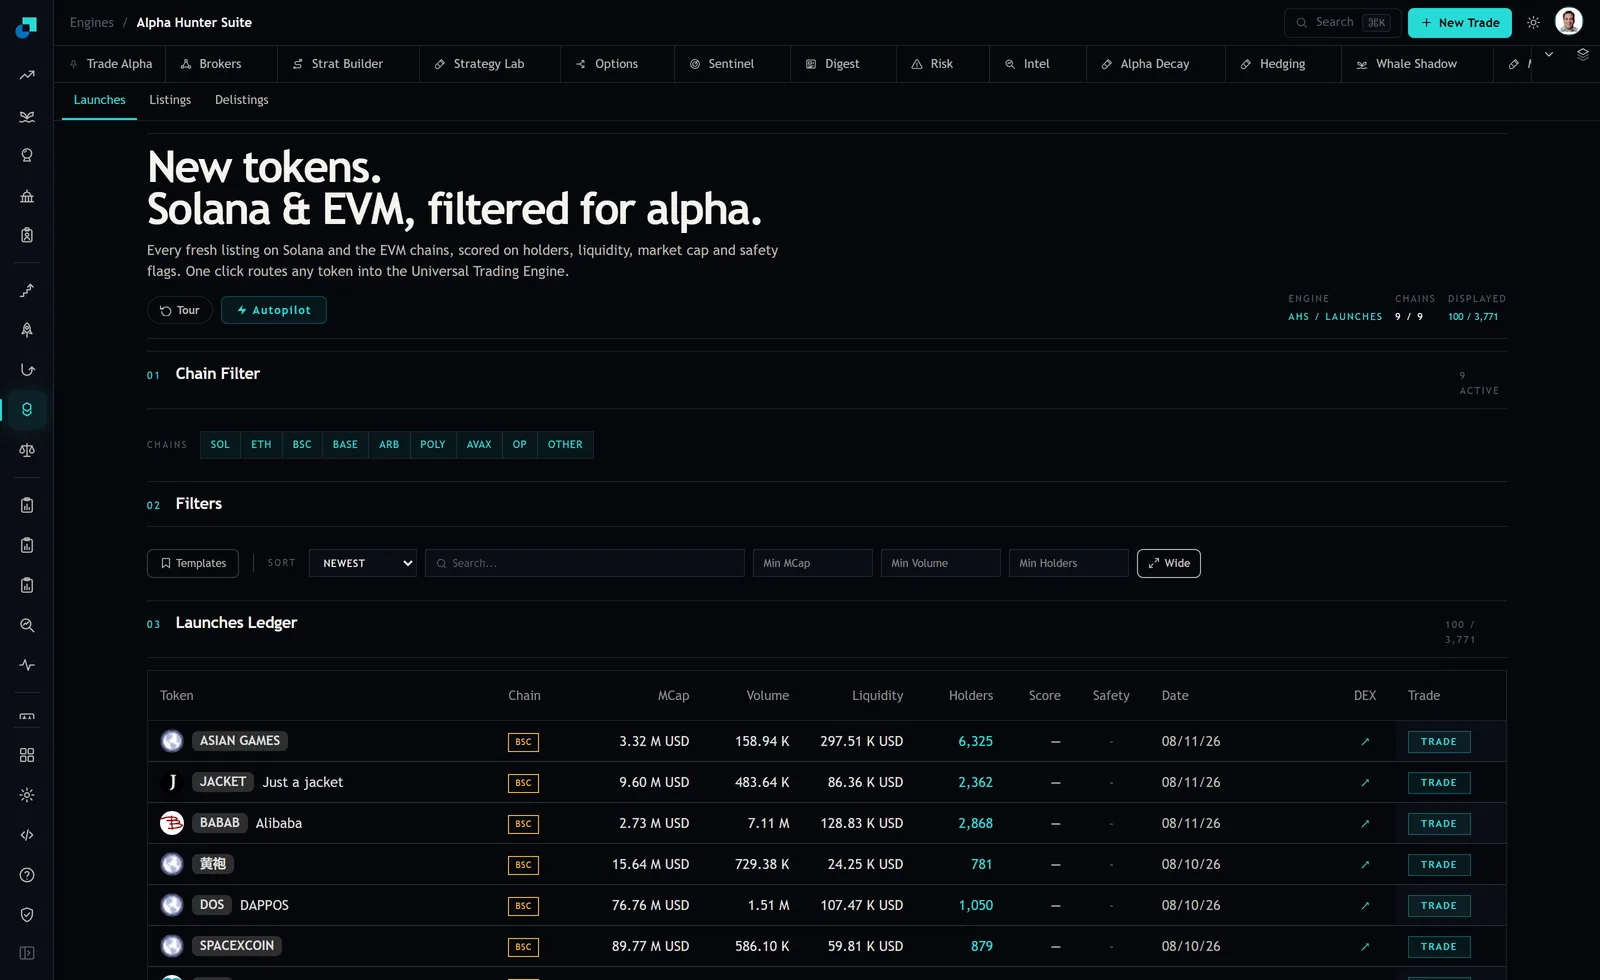
The chain filter sits at the top of the launches page as a row of nine chips. SOL, ETH, BSC, BASE, ARB, POLY, AVAX, OP, and OTHER. On the capture in front of me all nine are active, the header confirms it with a chains counter reading 9 of 9, and the sort is set to newest. Every single row visible in the ledger below is BSC.
That is not a filter setting. Nothing has been switched off. With all nine chains admitted and the newest launches at the top, a screen of one chain is a measurement of what got deployed in the last day or two, and it is one of the more informative things the module tells you without labelling it as information at all.
Treating nine chips as a histogram rather than a switchboard
Most people use the chain filter the way you use a checkbox. Turn off the chains you do not trade, get on with the day. That throws away the reading.
The useful habit is the opposite. Turn every chip on, sort by newest, and read the Chain column down the ledger as a sample. On my capture that sample is six of six BSC. Do that once a week and the sequence of readings tells you where new-token activity is concentrating and, more usefully, when it moves.
The header block carries two counters worth watching while you do this. One reads 9 of 9 for chains, the other reads 100 of 3,771 for rows displayed. What those counters do as you deselect chips is the fastest way to get a rough distribution rather than a top-of-list impression, and it is a reading you take yourself by clicking through rather than a breakdown the page hands you. I would rather tell you to go and check what the numbers do on your own screen than describe a panel I have not confirmed exists.
What a flood is measuring, and what it is not
A chain dominating new issuance is telling you about the cost and convenience of deploying, plus where the audience currently is. Cheap block space means a deployer can launch twenty contracts for the price of one somewhere else, and a chain with a popular launchpad and an active audience of buyers concentrates both the supply and the attention in the same place. Those two feed each other, which is why the concentration when it happens tends to be extreme rather than gradual.
Here is the part that matters. Issuance share is not liquidity share, and it is definitely not quality. A chain producing most of the new tokens is producing most of the new tokens. The pools on the capture run from 24.25 thousand dollars to 297.51 thousand dollars of liquidity against market caps between 2.73 million and 89.77 million. High issuance and thin pools are the same phenomenon viewed from two angles, because the thing that makes launching cheap also makes launching casual.
The second thing it is not is durable. Launch concentration moves. It has moved repeatedly, and the mechanism is always some combination of a fee change, a new launchpad, or a run of visible winners pulling deployers across. A feed dominated by one chain today is a statement about today, and the useful posture is to treat it as a current reading rather than a fact about the world.
Pricing what it costs you to follow it
The instinct when the feed floods one chain is to go where the activity is. Before you do, count the whole cost, because retail-sized positions are where these costs bite hardest and they are almost never counted.
There is the bridge, in both directions, and the time it takes. There is the base asset you now have to hold on that chain for gas, which is a small permanent position in something you did not choose to own. There is a wallet and RPC setup you have not used before, which is where mistakes happen. There is routing through a DEX you do not know well, on pools whose depth you have not learned to read. And there is the record-keeping, because every bridge leg and every swap on a new chain is another line you have to reconstruct at tax time.
Put a number on it. If the round trip in and out, bridge fees plus gas plus slippage, comes to forty dollars and your position is five hundred, you have handed over eight percent before the trade has an opinion. On a two thousand dollar position it is two percent, which is survivable but still worse than the same trade at home. That fixed cost is the reason chain-hopping for small positions rarely works out, and it is entirely knowable in advance. Bridge a small amount first, price the round trip for real, and then decide.
The other cost is concentration you did not intend. If the flood pulls your whole speculative book onto one chain, you now hold correlated exposure to that chain's bridge, its dominant stablecoin, and its sequencer or validator set. Those risks are not diversified by holding six different tokens on top of them.
The read that is defensive rather than directional
If you want one use for this that is more reliable than the obvious one, it is this. Watch for the flood to leave, not for it to arrive.
New issuance is a rough proxy for where the marginal speculative buyer is spending attention. When the newest rows in the ledger stop being a chain you hold positions on, the pool of people who might buy your small caps on that chain has started shrinking. Nothing about your token has changed. The number of people looking at that chain's new listings every morning has. Exit liquidity for thin tokens is made of attention, and attention is what the Chain column is sampling.
That makes the flood a better sell signal than a buy signal, which is the reverse of how most people use it. Arriving late to a chain that is already flooded means competing with everyone who arrived earlier for the same thin pools. Noticing that a chain you are exposed to has dropped out of the newest rows entirely gives you a reason to check your open positions while there is still somebody on the other side.
A five-minute weekly reading you can actually keep
The version of this that survives a busy week is short.
- Open the launches ledger with all nine chips active and the sort on newest. Do not filter anything yet.
- Read the Chain column down the first fifty rows and tally it. You want a rough share, not a precise one. Six of six on one chain is a flood, and so is forty of fifty.
- Write the tally in the same place every week, with the date. Two data points are worth nothing and eight are worth a lot, because the whole value is in the change.
- If the leading chain changed since last week, open your existing positions on the chain that lost share before you look at a single new token. That is the action, and it is the one with a deadline.
- Only then apply your usual liquidity, holder and market cap filters and look for anything new. Set them once and save the filter set so this step takes seconds rather than minutes.
The reason to do the tally before the filtering, rather than after, is that filtering destroys the measurement. Apply a liquidity floor and you are no longer looking at where tokens are being deployed, you are looking at where deployed tokens met your threshold, and those are different questions with different answers. Take the reading raw, write it down, then go and do your actual screening.