The check that has saved me the most money on this platform is reading the sample size before reading the return. It sounds trivial and it is not, because every performance panel ever built puts the return in large type and the sample size in small grey text underneath, and the return is the number that decides nothing while the sample size is the number that decides everything.
This panel is not an equity curve, and that changes what you can conclude
First, a correction to a common expectation, including my own the first time I opened it. The Performance tab on Insider Alpha is not a strategy backtest. There is a separate Backtest tab in the module's navigation, and this is not it. What this page shows is a forward-return attribution, which is a different object with different uses.
The page describes its own method plainly: for every past insider filing it tracks the actual forward return at 7d, 30d, 90d and 1yr and compares it to SPY over the same window, with no cherry-picking and every scored filing counted. That is a statement about a population of filings. It is not a statement about a portfolio, and so there is no equity curve on it, no drawdown figure, no turnover, no holding period and no position count.
Those omissions are not a flaw, they are a consequence of what the page is measuring, but they matter for the reader who arrives wanting to know whether a strategy is worth running. Drawdown and turnover are precisely the numbers that decide that, and you will have to get them somewhere else. What this page can do is tell you whether the raw material has any edge in it at all, and that is worth knowing first.
The four numbers that carry the weight
With the range set to the last year and no side or size filter applied, the panel at capture read as follows. N filings of 20,000. A 7D forward return of plus 0.25 percent. SPY over the same windows at plus 0.07 percent. A win rate of 46 percent, on 20,000 scored filings. The 30D, 90D and 365D tiles each showed a dash and zero scored filings.
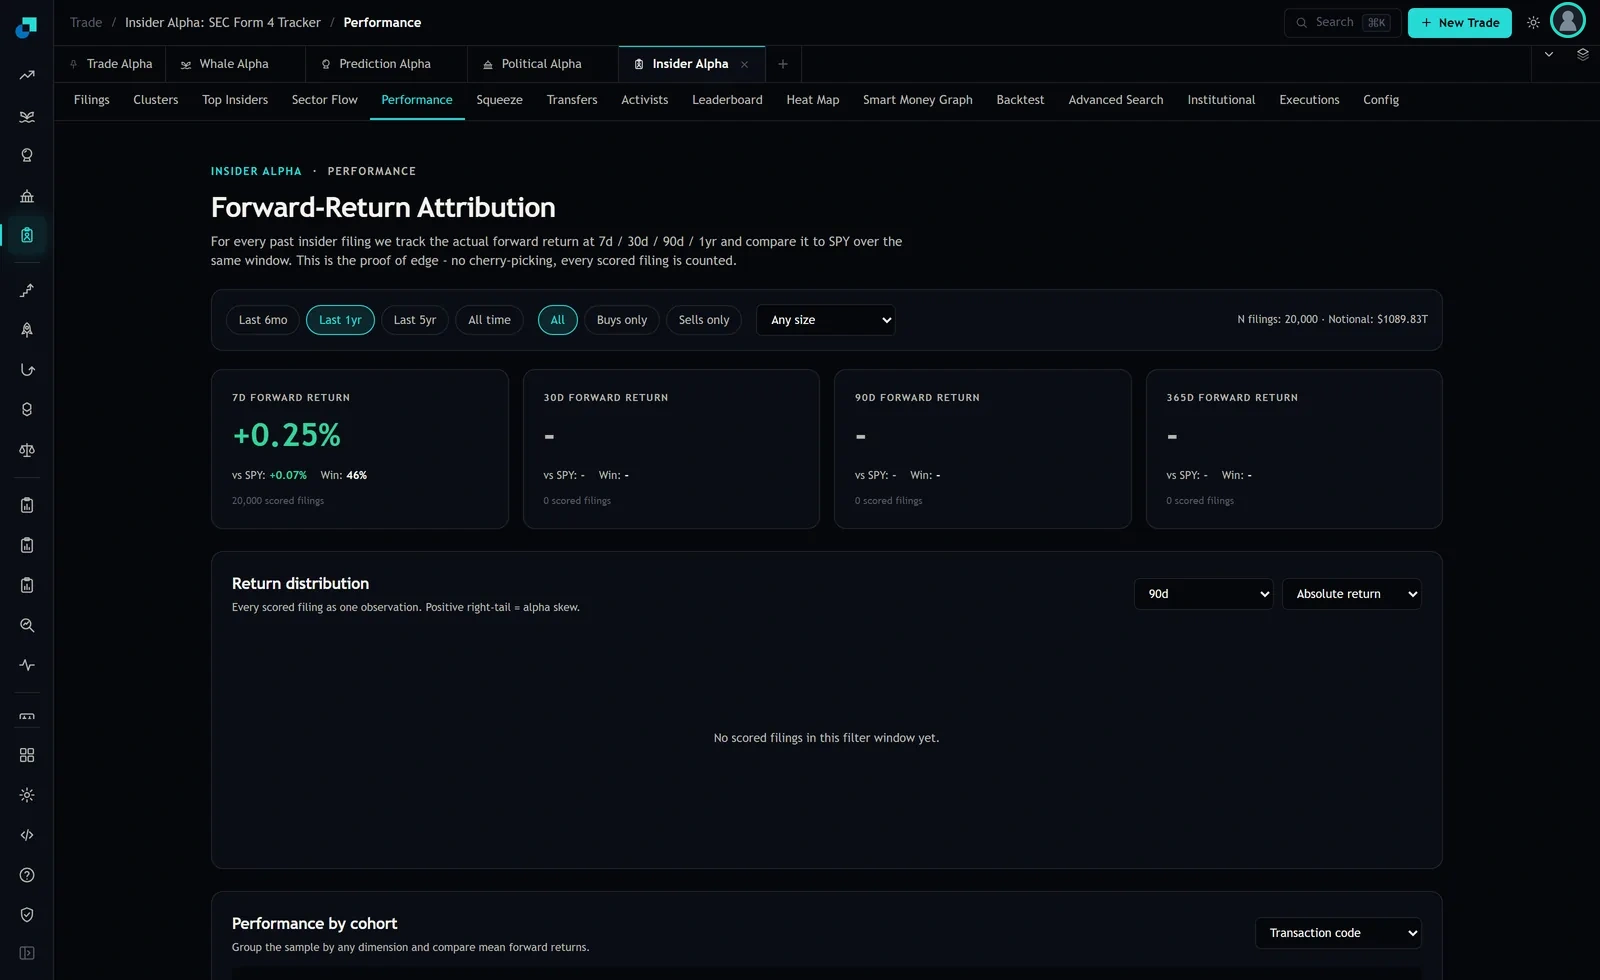
Start with N. Twenty thousand is a suspiciously round number, and a round N is almost always a cap rather than a population. That does not invalidate anything, but it does mean you should not describe this as every filing of the last year, and if you change the filters you should watch whether N moves off 20,000 before you compare two readings against each other.
Then the empty tiles. Zero scored filings at 30, 90 and 365 days is not a result. It is an absence of data at those horizons in this filter window, and confusing the two is the single easiest mistake to make on a page like this.
A 46 percent win rate with a positive mean tells you where the money is
This pairing is the most useful thing on the page and it is easy to skim past. Fewer than half the filings were followed by a positive seven day return, and yet the average was positive. Those two facts together mean the average is being carried by a right tail: a minority of filings did well enough to outweigh a majority that did not.
The page has a panel built for exactly this, headed Return distribution, which describes every scored filing as one observation and notes that a positive right tail indicates alpha skew. At capture it rendered empty, with the message that there were no scored filings in the filter window. The reason is visible if you look at its own controls: the horizon selector was sitting on 90d, and the 90d bucket had zero scored filings. So the chart was empty because of its default setting, not because the data says nothing.
That is a trap worth naming explicitly. An empty chart looks like a negative finding and is not one. Before concluding anything from a blank panel, check the selector above it against the horizon tiles that actually have data.
Eighteen basis points is the entire edge, before you pay anything
Here is the arithmetic that should govern what you do next. The filings returned plus 0.25 percent over seven days. SPY returned plus 0.07 percent over the same windows. The difference is 0.18 percentage points, or 18 basis points, over a week, before any cost at all.
Put that in dollars on an account you might actually have. On a 1,000 dollar position, 18 basis points is 1 dollar 80 cents. On a 5,000 dollar position it is 9 dollars.
Now price the friction. A one-cent spread on a 20 dollar stock is 5 basis points, and you pay it going in and coming out, so a round trip in a liquid name is around 10 basis points of your 18. That leaves you 8. In a small company with a 2 percent spread, the round trip is 400 basis points and the edge is not merely gone, it is buried more than twenty times over.
This single calculation does more to shape a sensible retail process than any amount of signal selection. It says the population-average insider edge, as this page measures it, only survives in names where you can get in and out cheaply, and that it does not survive frequent trading. It also says that if your version of this strategy involves ten round trips a year in illiquid microcaps, the honest expectation is a loss, and no amount of filter tuning changes the spread you pay.
What to do with the panel this week
Use the filters to describe a trade you would actually place, then read N first.
The controls are there: a date range of last 6mo, last 1yr, last 5yr or all time, a side selector for buys only or sells only, and a size dropdown offering thresholds at 25 thousand, 100 thousand, 500 thousand and one million dollars. If you would only ever act on purchases above a hundred thousand dollars, set that, and see what happens to the sample.
Then apply the rule that makes this worth doing. If your filter leaves a few hundred filings, a difference of a fraction of a percentage point is not something you can size a position on, and the correct response is to widen the filter or abandon the idea rather than to trust the number. If it leaves thousands, look at the win rate before the mean, and remember that a mean carried by a right tail means most of your individual trades will lose even if the process works.
One last field to treat with suspicion. The header at capture read a notional of 1089.83 trillion dollars alongside those 20,000 filings, which cannot be a literal dollar total of anything. I do not know what that field is summing, and neither do you, so leave it out of any calculation until you do. A number you cannot explain has no place in a decision, however prominently it is displayed.