Most single-name caps inside a sector sleeve are round numbers inherited from an equity mandate. Five percent, sometimes ten, occasionally a per-name cap expressed as a multiple of the benchmark weight. None of those numbers know anything about the sector they are applied to, and in crypto that is a live problem, because the spread of outcomes inside a bucket over a single week can exceed the spread across the entire equity market over a quarter.
The variable the cap should be derived from is within-sector dispersion: how far the members of a bucket finish from each other over your holding period. It is measurable, it is unstable, and it differs enough between buckets that one cap across all of them is a decision to be wrong in two directions at once.
Dispersion is the number the panel almost gives you
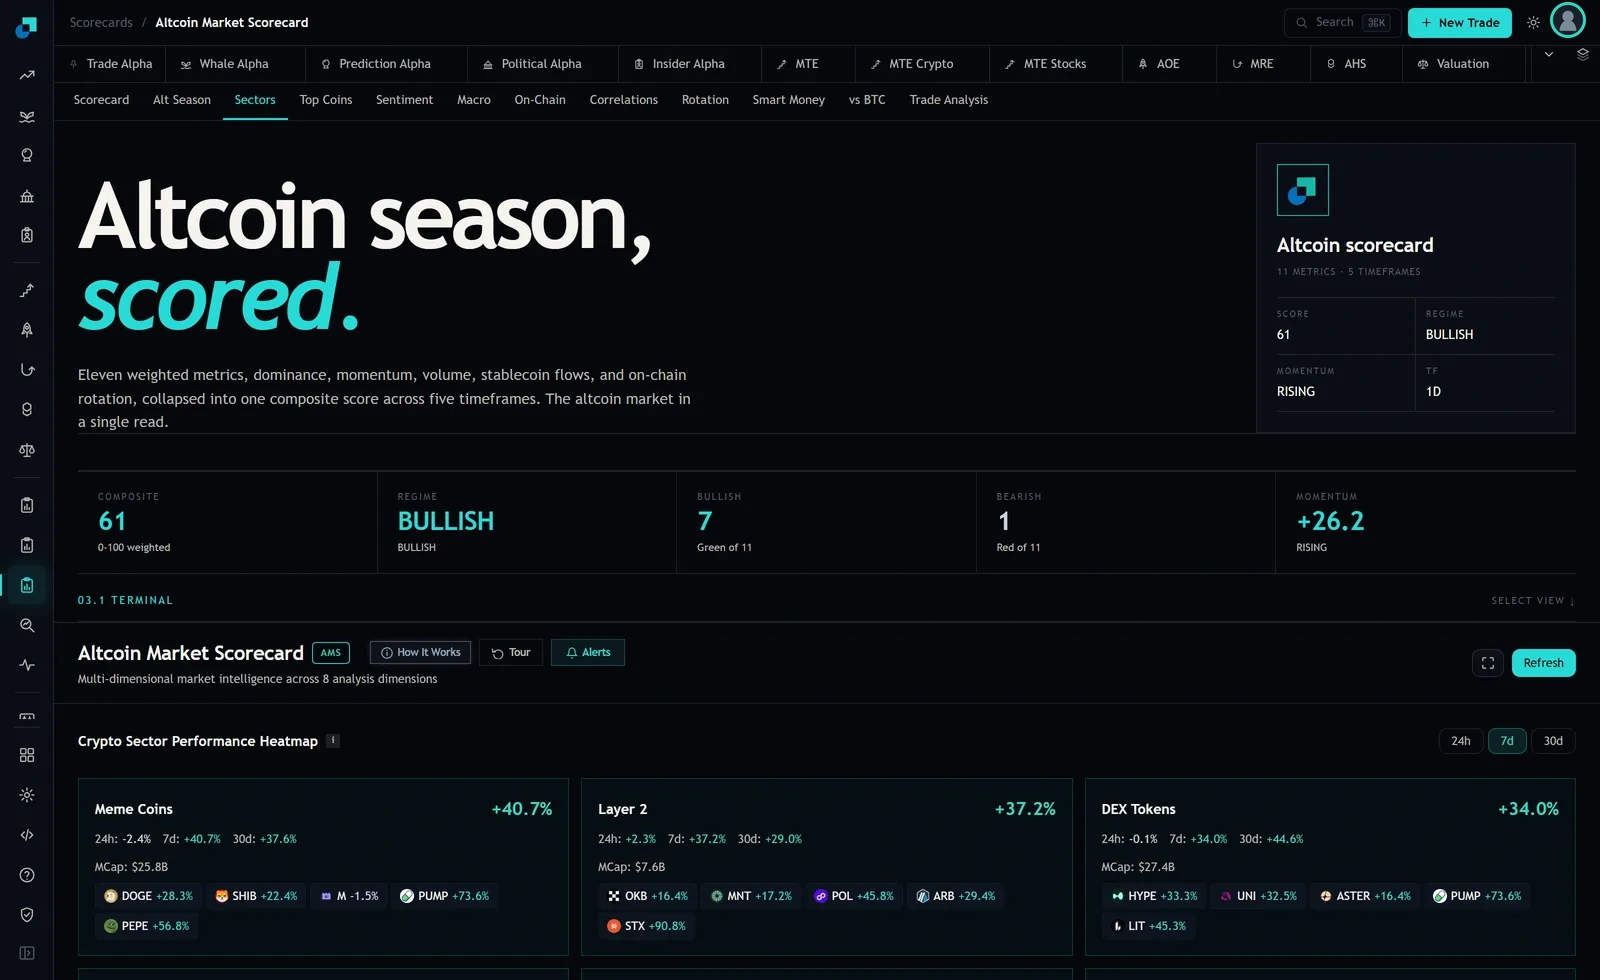
The sector heatmap prints a headline return per bucket and the constituent returns underneath it. Dispersion is not printed, but it is one calculation away from the chips.
On the 7d toggle at capture, Meme Coins listed five members spanning minus 1.5 percent to +73.6 percent, a range of 75.1 points, with a sample standard deviation across those five of about 29.6 points. Layer 2 spanned +16.4 to +90.8 percent, a range of 74.4 points and a standard deviation of about 30.8. DEX Tokens spanned +16.4 to +73.6 percent, a range of 57.2 points and a standard deviation of about 21.3.
Read those three numbers and the first useful fact appears immediately: DEX Tokens is a meaningfully tighter bucket than the other two, roughly two thirds of their spread. Its members behaved more like members. Meme Coins and Layer 2 members behaved like a collection of unrelated single names that share a label.
The second useful fact is a warning about the estimate itself. Five observations over one window is not a dispersion estimate you can size on. The standard error of a standard deviation computed from five points runs at roughly a third of the estimate, so a reading of 30 is consistent with a true value anywhere from about 20 to about 40, and that range spans limits that differ by a factor of two. The panel is the right place to see the shape. It is the wrong place to source the parameter.
From a dispersion estimate to a single-name cap
The cap follows from one question the risk committee can actually answer: how many basis points of sleeve return are we willing to attribute to one name being wrong about its own sector.
Write it out. Let w be the single-name weight inside the sleeve, s the cross-sectional dispersion of member returns around the sector return over the holding period, and k the multiple of that dispersion you want to be covered for. The sleeve impact from that name's deviation is approximately w multiplied by s multiplied by k, and you set the cap so that impact stays inside your tolerance.
With a tolerance of 50 basis points of sleeve return, a dispersion estimate of 30 percent over a one week horizon and a k of 2, the cap comes out at 0.005 divided by 0.60, or roughly 0.8 percent of the sleeve. With a tighter bucket at 20 percent dispersion the same tolerance supports about 1.25 percent. Those inputs are illustrative and the numbers move a long way with all three of them, which is the point: the cap is a function, not a convention, and a desk that writes five percent for every bucket has not made a risk decision, it has skipped one.
Two refinements are worth building in from the start. First, use the dispersion of returns relative to the sector, not total return dispersion, because the sector exposure is deliberate and already sized elsewhere. What the single-name cap is controlling is the part of the outcome you did not intend to take. Second, dispersion is not stationary. Estimate it on a rolling basis, use a conservative upper quantile of the recent distribution rather than the point estimate, and re-derive the caps on a schedule rather than after an incident.
The dispersion level below which selection stops paying
There is a level at which picking names inside a bucket stops being worth the idiosyncratic risk it adds, and it is worth being precise about where that number comes from, because it does not come from the panel and no display can supply it.
Selection pays when the expected spread you capture between your picks and the bucket exceeds the cost of taking it. Expected capture is your information coefficient multiplied by the dispersion available: a skilled selector in a wide bucket earns more in absolute terms than the same selector in a narrow one, which is why dispersion is often described as the raw material of stock picking. The cost side is the round-trip execution cost of holding concentrated positions instead of the basket, plus whatever risk charge your process applies to the idiosyncratic variance you have added.
Set those equal and the break-even is where dispersion multiplied by your measured information coefficient equals cost plus risk charge. Below that dispersion level the selection sleeve is paying for variance it cannot earn back and the honest move is to hold the bucket rather than pick inside it. The threshold is specific to your desk because two of the three inputs are, and it is a measurement you own: the information coefficient comes from your own realised picks against their own buckets, over enough periods to be worth quoting, and the cost comes from your own fills rather than from a quoted spread.
What the panel contributes is the dispersion term, and only once you have rebuilt it properly from a constituent history rather than from five chips on a card.
Why one cap cannot cover every bucket
The cards also print a combined market capitalisation, and it carries the second half of the limit. Layer 2 showed 7.6 billion dollars against 25.8 billion for Meme Coins and 27.4 billion for DEX Tokens.
A bucket at a third of the size of its neighbours does not just have higher dispersion, it has less room. A cap expressed purely as a percentage of the sleeve will, in the smallest bucket, permit a position that is a large fraction of a day's realistic volume in one of its members, and your realised cost will show up in basis points of implementation shortfall rather than in the risk report. So carry two constraints per name and take the binding one: the dispersion-derived cap above, and a liquidity cap expressed as a fraction of participation-adjusted daily volume for the specific token, not for the bucket.
The liquidity constraint is also the one that changes fastest, and in the direction you least want, because thin books thin further exactly when a sector unwinds. Stress the liquidity cap at a fraction of normal volume rather than at normal volume, and size the position to the stressed number.
What goes in the limit document
The cap survives a review only if the derivation is written down, so record the dispersion estimate and the window it was measured over, the tolerance in basis points the committee approved, the k multiple, the resulting cap per bucket, the liquidity constraint and its stress assumption, and the date the parameters are next re-derived. Add the count of members the dispersion was estimated from, because that single number tells the next reader how much confidence the limit deserves.
When a position breaches, the question in the room will be whether the limit was set carelessly or whether the market moved outside a documented assumption. Those two have very different consequences and only one of them is defensible, and the difference between them is entirely a matter of what you wrote down before the breach.