The question that produces a latency budget is never "how fast are we". It is a mandate holder asking why a fill printed forty basis points away from the price in the research note, and the honest first answer being that nobody knows which part of the chain ate the time. A budget is not a performance target. It is an attribution instrument, and its job is to make that question answerable in one query rather than in a week of log archaeology.
None of what follows is about competing on speed. A signal stack running on hosted infrastructure and retail broker APIs is not in that game and should not pretend to be. It is about knowing your own distribution well enough to notice when it changes, and to say in a review which segment moved.
What a budget is for when you are not a market maker
Three specific things justify the work, and none of them is a faster fill.
- Attribution. Implementation shortfall splits into decision delay and execution cost only if you can date each handoff. Without segment timestamps, everything lands in one undifferentiated bucket and every explanation is a story.
- Regime detection. The distribution of your own latency is a monitoring signal in its own right. A broker segment whose median doubles is telling you something about that broker's load, days before it shows up in fills.
- Capacity honesty. If a strategy's edge is measurably worse at your realised delay than at zero delay, the strategy has a delay sensitivity, and that belongs in the capacity discussion alongside size.
Notice what is missing. There is no claim here that tightening a segment improves returns. It might not. The budget tells you what you are paying in time so the question can be asked with numbers.
Cutting the chain into segments somebody owns
The chain only becomes measurable when each segment has a clock and an owner. Six segments cover a signal driven stack, and the discipline is that every boundary is a timestamp somebody is accountable for.
| Segment | From, to | Owner |
|---|---|---|
| Generation | Market event to signal emitted by the engine | Vendor, per engine |
| Transport | Emit to arrival in your queue | Vendor and your ingest |
| Decision | Arrival to order intent formed | You, and this is the one you control |
| Risk and sizing | Intent to order released | You |
| Broker acknowledgement | Release to broker ack | Broker |
| Fill | Ack to execution report | Venue |
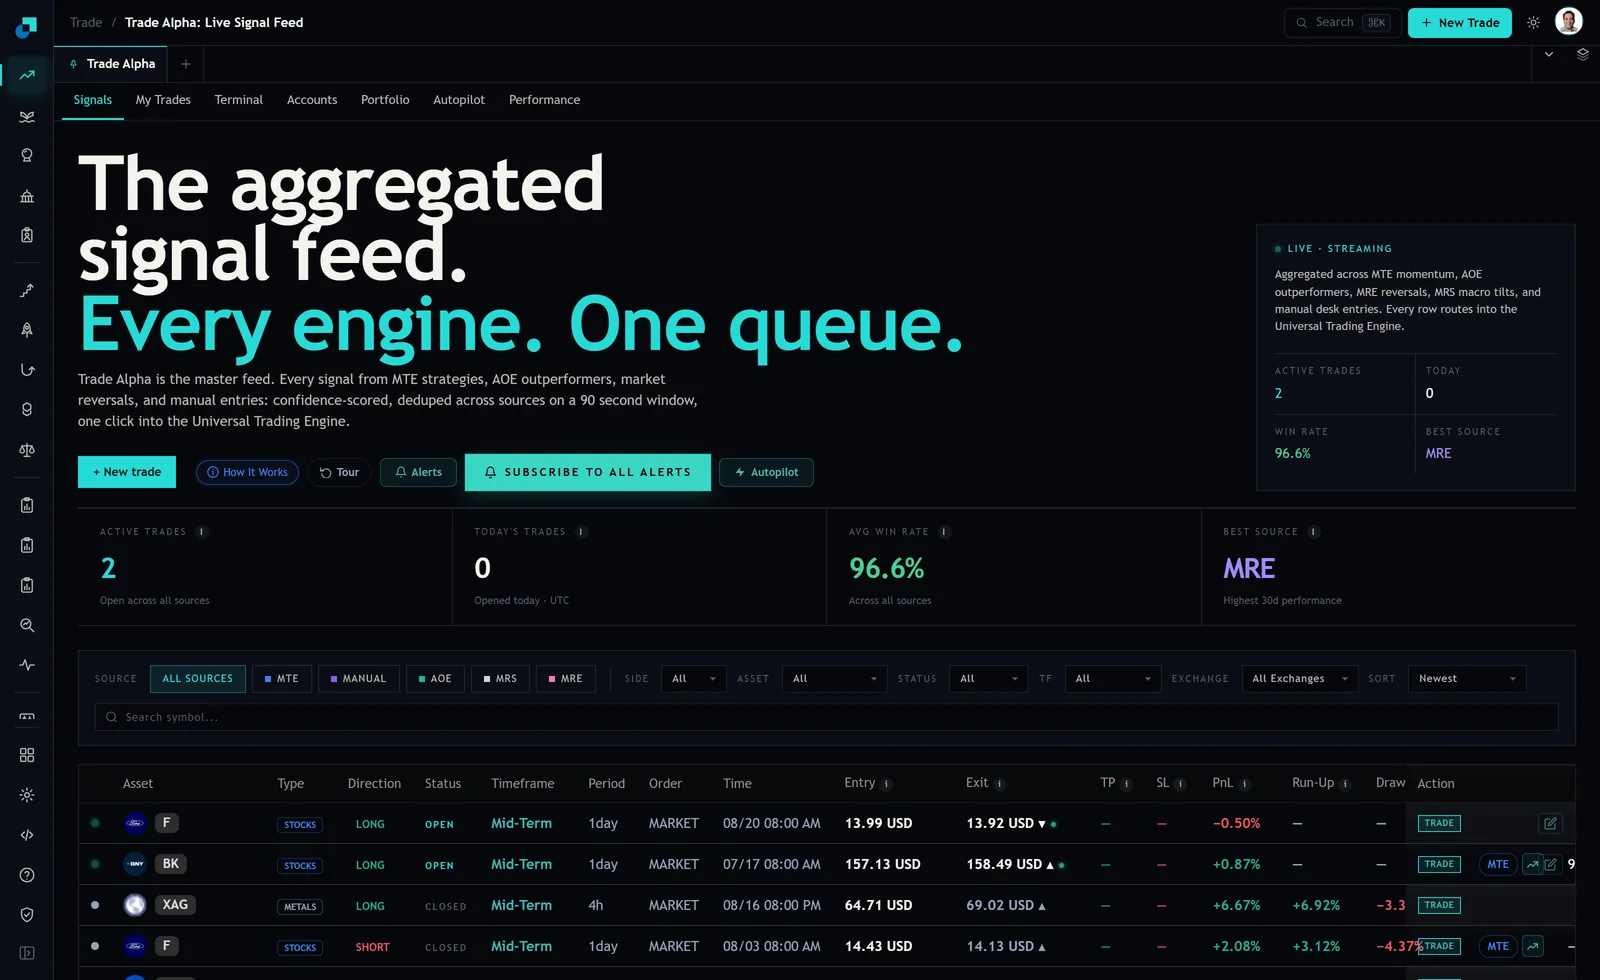
The feed shown above aggregates several engines into one queue, and that is exactly why generation cannot be a single number. The panel lists its sources as momentum, reversal and outperformer engines alongside whale, insider, political and prediction trackers. A momentum engine computing off a closed candle and an insider tracker waiting on a regulatory filing have generation latencies that differ by orders of magnitude and for reasons that are structural rather than technical. Budget them separately or the aggregate is meaningless.
A caution before you write numbers into that table. The captured panels do not publish per segment latency figures, so a budget is something your desk measures and then commits to, not something you can read off the product and cite. Anyone who hands you a service level for these segments without a measurement campaign behind it has produced a document, not a control.
Size each segment against the signal's own bar
The mistake that makes budgets useless is a single global number. Two hundred milliseconds means nothing without knowing what the signal was waiting for. The execution terminal exposes timeframes from one minute through to one week, and a signal's own timeframe is the natural denominator.
Express the budget as a fraction of the bar the signal was computed on. One percent of the bar interval, allocated across the segments you control, is a defensible starting rule and it scales sensibly. On a one minute strategy it gives you 600 milliseconds total. On a four hour strategy it gives you 144 seconds, which is enough time for a human to be in the loop, and on a daily strategy it gives you fourteen minutes, which is why insisting on sub-second handling for a daily momentum signal is engineering effort spent in the wrong place.
Two adjustments to that rule are worth making explicit in the document. Any signal that is queue-position sensitive, meaning it targets a price other participants are also reacting to, gets a much tighter fraction and probably should not be traded at all on a stack you have not built for it. And any signal whose expected holding period is measured in days should have its decision segment budgeted generously on purpose, because a deliberate human check that costs thirty seconds against a nineteen day average hold is nearly free and catches a whole class of operational errors that speed cannot.
The breach rule, and who gets paged
A budget without a breach definition is a wall chart. The definition needs to be specific enough that a monitoring system can evaluate it without a person interpreting it, and it needs three parts.
- The statistic. Median for the health check, ninety fifth percentile for the alert, and the maximum kept only for the incident file. Median alone hides the tail that costs money. The maximum alone pages you for one garbage collection pause.
- Persistence. A single sample never pages. Something like the ninety fifth percentile exceeding budget across a rolling window of twenty signals, or three consecutive samples above the maximum, forces the alert to describe a condition rather than an event.
- Segment attribution in the alert itself. The page should name the segment. An alert that says the chain is slow, with no owner attached, gets acknowledged and ignored inside a fortnight.
Then decide what the page is for, which is the part most desks skip. If the answer is that a human looks at a dashboard and feels concerned, do not page. Page only where there is an action. Halt new entries for the affected source. Fall back to a second broker connection. Switch the affected strategies to limit orders because the delay has made marketable orders a worse bet. Write the action next to the threshold, and if you cannot write an action, the threshold is a report line rather than an alert.
Where the clock lies
Everything above assumes your timestamps mean the same thing, and across a multi-vendor stack they do not. The engine stamps in its own clock. The broker stamps in its own. The venue stamps in a third. Two of those three are outside your control and none of them is guaranteed to agree with the others to better than tens of milliseconds.
Which sets a floor on the precision you are allowed to report. If your clock skew against a broker is fifty milliseconds and unmeasured, a segment budget of eighty milliseconds against that broker is a number with no information in it. The practical discipline is to measure only what one clock can measure. Round trip timings taken entirely on your own host, against a reference you sample continuously, are trustworthy. Differences computed between two vendors' timestamps are indicative and should be labelled as such in the report, not quietly averaged into the same column as the trustworthy ones.
The related trap is the arrival timestamp on a streaming feed. What you can honestly stamp is when your process handled the message, which includes your own queueing. Under load that is not the same as when the message reached your host, and the difference will show up as vendor transport latency in your report while being entirely yours. Stamp at socket read as well as at handler entry, keep both columns, and the first time the two diverge you will have found a genuine capacity limit rather than a vendor to complain to.