The Momentum Trading Engine reports what a strategy returned and what it returned above the symbol it was trading, and most people read the first number and stop there. That is the expensive habit. Return tells you what the strategy did. Alpha tells you what the strategy did that you could not have got by buying the symbol once and going to sleep, and those two are different often enough to reverse the order of your shortlist.
The engine treats them as separate questions. Open the leaderboard tab and the rank-by control offers Overall Score, Total Return, Risk-Adjusted Return, Win Rate, Alpha and Profit Factor as six different orderings of the same set of deployments. Total Return and Alpha sit on that list as distinct choices because they disagree. If they always agreed there would be no reason to ship both.
Return is two things welded together
A strategy return on a single symbol is a sum. Part of it is the drift of the instrument over the test window, which the strategy collected merely by being long during some of it. The rest is whatever the entry and exit rules added or destroyed on top of that drift. Alpha isolates the second part by netting out the symbol's own buy and hold over the same window.
Notice the benchmark. This is not alpha against a broad index or against a factor model. It is alpha against the one alternative you actually have when a strategy row is in front of you, which is holding the thing the strategy trades. The question the column answers is narrow and useful. Did the rules beat doing nothing on this symbol.
You can see the same framing in the notes the engine attaches to its own configurations. One crypto configuration running on a Solana perpetual is described as a swing strategy with a 92 percent win rate, a 15 percent drawdown, and outperformance of buy and hold by 19 times. A configuration on a Curve pair is described as 99 percent win rate, 16 percent drawdown, outperforming buy and hold by 5 times. Neither note leads with a raw return figure. Both lead with a multiple of the thing you would have got by holding, and that is a deliberate choice.
Two rows that trade places when you change the sort
Here is the shape of the trap with round numbers, so the arithmetic stays visible. Strategy A returned 168 percent on a symbol that returned 61 percent buy and hold over the same window. Strategy B returned 296 percent on a symbol that returned 248 percent. Sort by return and B wins by 128 points and looks like the obvious deploy. Sort by alpha and A wins, 107 to 48, and it is not close.
Those are illustrative figures rather than a reading off any particular row, but the pattern behind them is the ordinary one. B rode a symbol that more than tripled. Almost any long-biased rule set would have made money on that symbol, and most of B's 296 percent is rent collected from the instrument rather than skill in the logic. A worked on something that went up modestly and still nearly tripled it. A is the one whose rules did something.
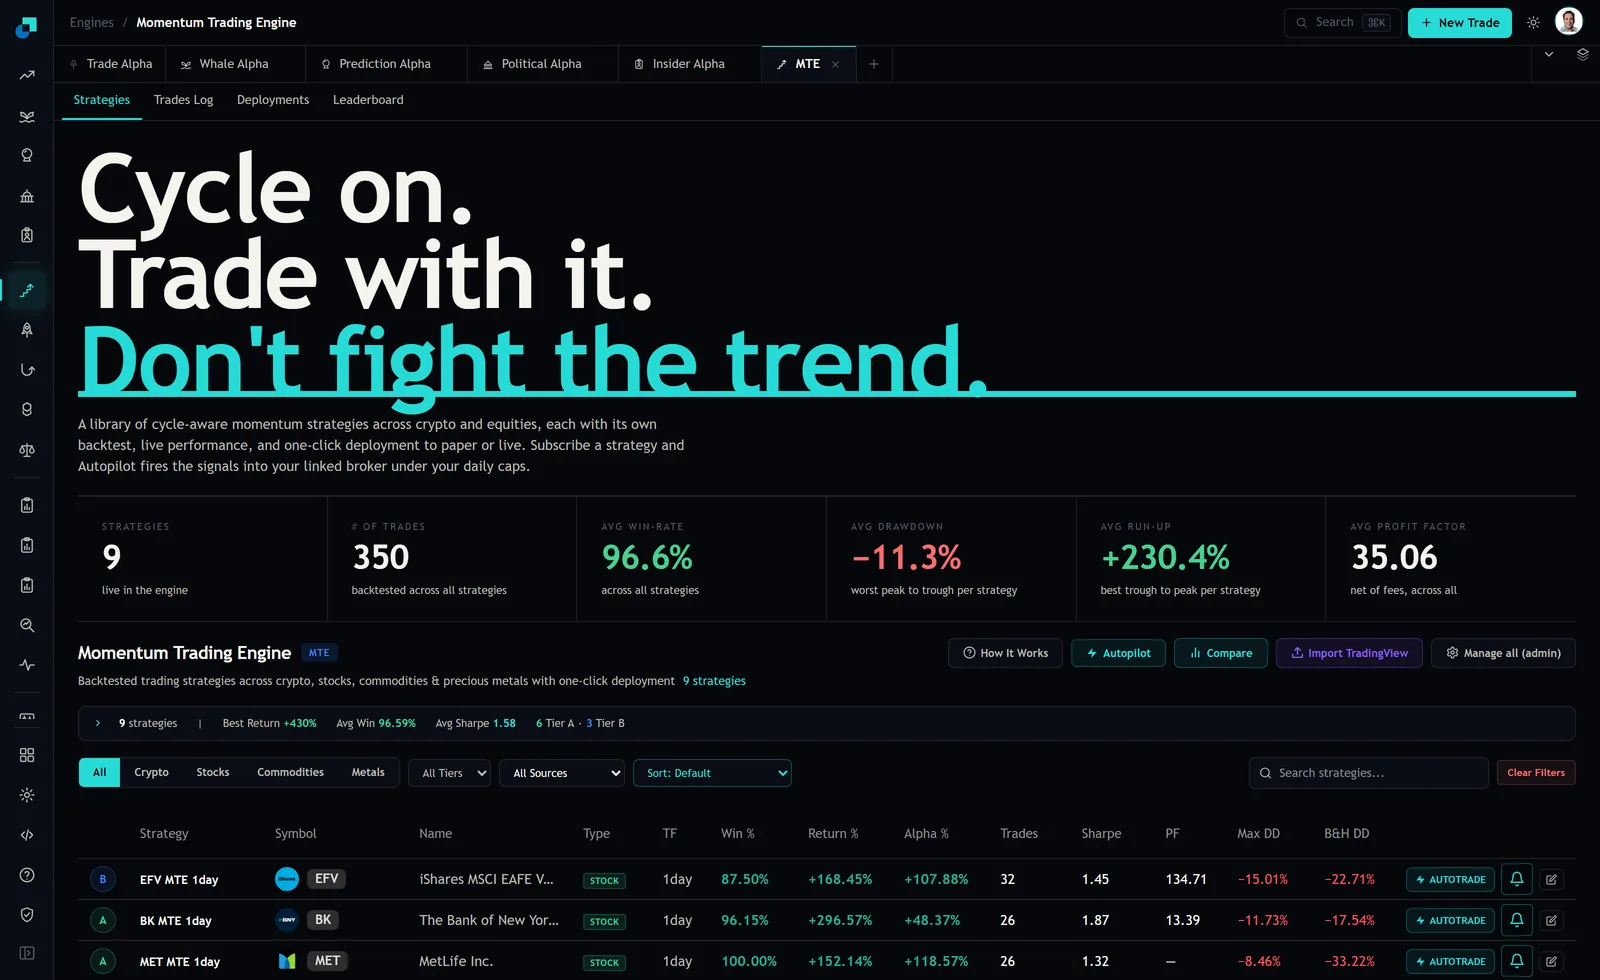
That header is worth sitting with for a moment. The engine puts six tiles across the top of every tab, covering strategy count, backtested trade count, average win rate, average drawdown, average run-up and average profit factor. Alpha is not one of them. It is available as a ranking, but it is not what the page shows you first, and what a page shows you first is what you end up screening on.
Where alpha will lie to you
Alpha is a relative number, and relative numbers have a failure mode that costs retail traders real money. A strategy can post strong alpha while losing you money in dollars. If the symbol fell 40 percent over the window and the strategy fell 12 percent, that is 28 points of alpha and a 12 percent hole in your account. Plus 28 is an honest description of the rules and a terrible description of your year.
This matters more for you than it does for a fund. A desk running a long and short book can convert relative performance into absolute performance by shorting the benchmark. You will not do that on a 3,000 dollar position in a single name, and you should not pretend otherwise when you are reading the column. So read alpha as a measure of whether the rules add anything, and read return as a measure of whether you get paid. Both need to be acceptable, and they are answering different questions.
The second trap is window dependence. Alpha computed over a window that contains one enormous trend is a statement about that trend and not much else. The engine reports 350 backtested trades across nine strategies, which is roughly 39 trades per strategy. An alpha figure resting on 39 trades is an estimate with a wide band around it, and the band is not printed on the row. Treat a 10 point difference in alpha between two strategies as noise. Treat a 60 point difference as worth a second look.
Reading the pair together
Four combinations, and each has a different action attached to it.
| Return | Alpha | What it means | What to do |
|---|---|---|---|
| High | High | The rules added on top of a strong instrument | Real deploy candidate. Check drawdown and trade count next |
| High | Low | The symbol is paying you, not the strategy | Price the alternative. Holding has no signal delay and no missed fills |
| Low | High | The rules worked on a difficult instrument | Check whether the absolute return survives your commissions and spread |
| Negative | High | Less bad than holding was | Not a long-only deploy. This is a sit-out or a hedge signal |
The last row is the one people misfile. A strategy that loses less than the asset is not a strategy that makes money, and an alpha sort will happily float it toward the top during a bad stretch for that asset. If you deploy it because it ranked first, you have bought a smaller loss and called it a win.
A ten minute pass before you deploy anything
Rank by Total Return and write down the top five. Then rank by Alpha and write down the top five. The names on both lists are your actual shortlist, and it is usually shorter than you expect. Names that appear only on the return list are instrument bets wearing a strategy costume. Names that appear only on the alpha list need one more check, which is whether the absolute return after your costs is a number you would accept in dollars.
Then do the thing almost nobody does, and look up what the underlying symbol did over the same window before you commit. If a strategy returned 296 percent on a symbol that returned 248 percent, you are choosing between a set of rules and a buy button, and the buy button has no signal delay, no missed fills and no monthly cost. Sometimes the buy button wins that comparison on the honest arithmetic. The alpha figure exists so that you can find out which case you are in before you put capital behind it, rather than eleven months later when you finally lay your strategy equity curve next to the chart of the thing it was trading.