Most people who say a token is outperforming mean it is up more than bitcoin. The Asset Outperformer board means something stricter. It runs each asset against five benchmarks, Bitcoin, Ethereum, Solana, gold and the S&P 500, and the #Out column reports how many of fifteen individual contests the asset won. Beating bitcoin is one of those fifteen. It is also, in most tapes, one of the easier ones.
The benchmark panel at the top right of the board is where you find out how hard the bar actually is on any given day, and it is the panel almost nobody reads before looking at the ranking.
The five bars, and which one is binding
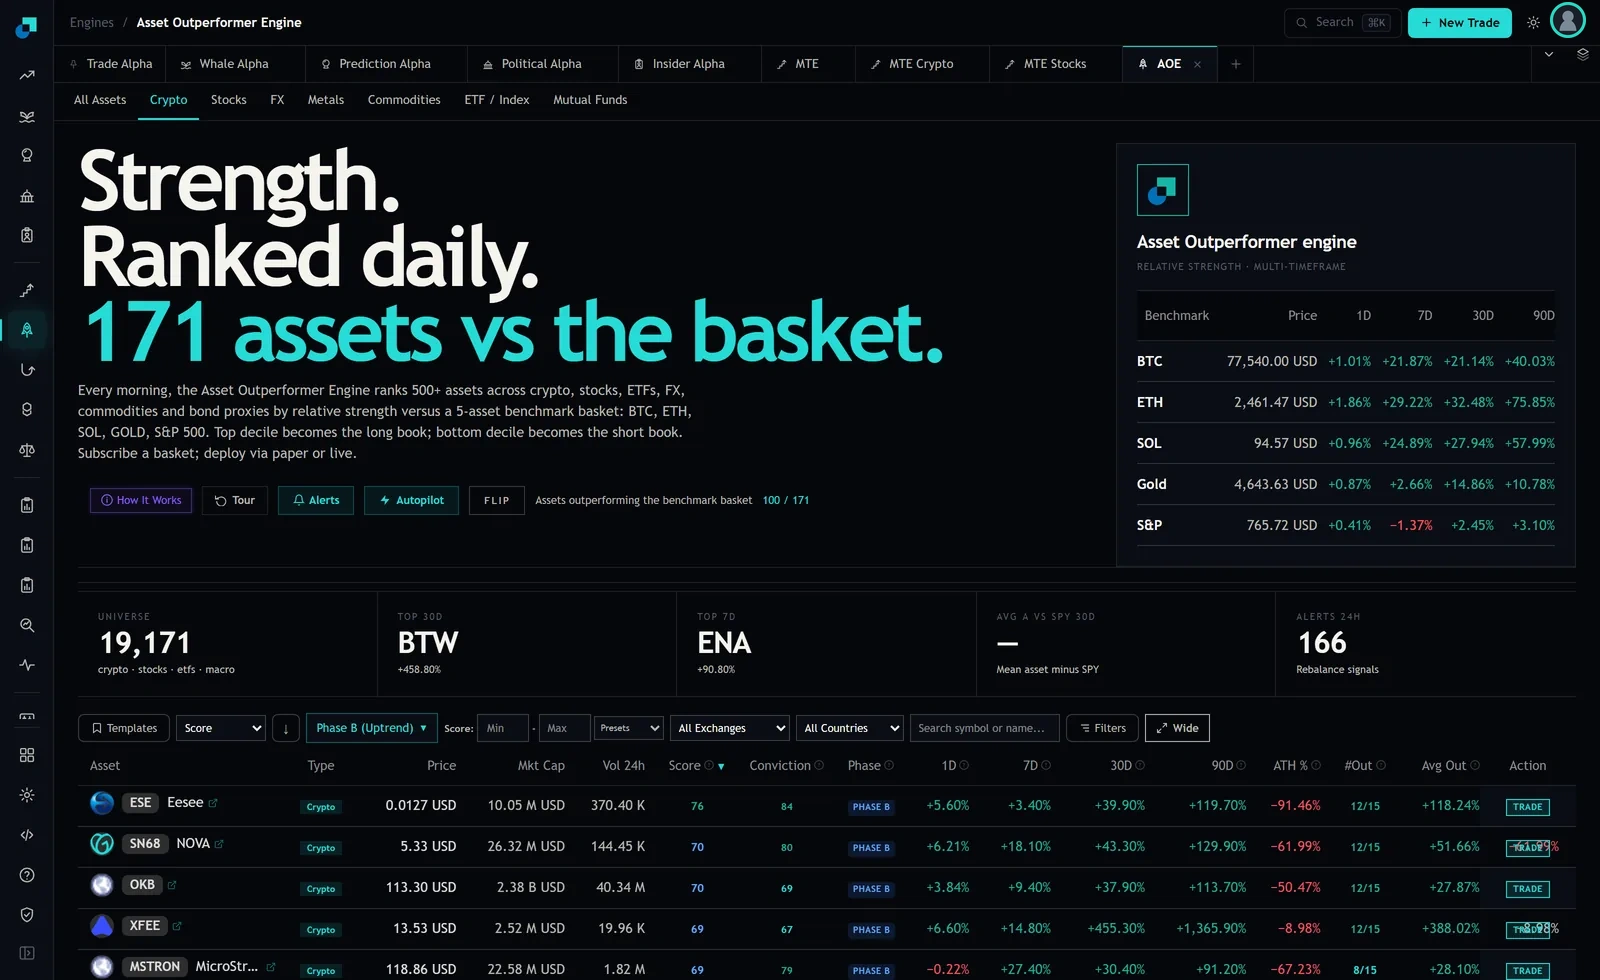
Here is that panel as it stood at capture. Over the trailing thirty days Bitcoin was up 21.14 percent, Ethereum 32.48 percent, Solana 27.94 percent, gold 14.86 percent and the S&P 2.45 percent. Over ninety days the same five read plus 40.03, plus 75.85, plus 57.99, plus 10.78 and plus 3.10 percent.
Read those rows as hurdles rather than as returns and the point falls out immediately. To beat every benchmark over thirty days a token had to clear 32.48 percent, because Ethereum was the strongest of the five. To beat only bitcoin it had to clear 21.14 percent. That is eleven percentage points of extra work for the same badge. Over ninety days the gap is worse: 40.03 percent gets you past bitcoin, and you need 75.85 percent to get past everything, which is close to double.
So when you see a token described as outperforming, the first question is outperforming what. On this board the answer is a moving target that is reset every morning by whichever of the five happened to be strongest.
Three correlated benchmarks are one hard benchmark
The instinct is that five benchmarks means five separate lotteries, and a decent token should win a few by luck. That is not how it works here, because three of the five are the same trade.
Look at the seven day column: Bitcoin plus 21.87 percent, Ethereum plus 29.22 percent, Solana plus 24.89 percent. Those three sit inside an eight point band because they were all responding to the same tape. In a week like that they collapse into a single hurdle, which is the strongest of the three, and if a token clears Ethereum it will almost certainly clear the other two as well. You are not being tested three times. You are being tested once, at the level of the best performer in the group.
The other two were nearly free in that same week. Gold was up 2.66 percent and the S&P was down 1.37 percent, so any token with a positive week beat both. That is a fact about the tape at capture, not a permanent property. Flip to a crypto drawdown with a firm equity market and the roles invert exactly: gold and the S&P become the binding hurdles, the crypto three become easy, and the count on your favourite token collapses without the token doing anything differently.
That is the honest reading of the #Out column. It is a relative measurement, and half of what moves it is the benchmarks, not the asset.
The count leaves the ninety day column out
Fifteen contests, five benchmarks. That is three time windows, and it is worth knowing which three, because the board displays four return columns and only three of them can be in the count.
You can work it out yourself in about ten minutes with the benchmark panel and any row on the board, and I recommend doing it once so the column stops being a black box. Take the tokenized MicroStrategy row at capture: 1D minus 0.22 percent, 7D plus 27.40 percent, 30D plus 30.40 percent, 90D plus 91.20 percent, printed count 8 of 15. Score it against the panel using 1D, 7D and 30D and you get zero wins on the day, four on the week, four on the month, total eight. That reproduces the printed number exactly. Do the same for Eesee, NOVA, OKB and XFee and all four come out at twelve, which is what the board shows for each of them.
The ninety day column, on that reading, is displayed but not counted. Treat this as my reconstruction rather than as gospel, because the header carries an information icon and that tooltip is the authoritative definition. But it reproduces on every crypto row I checked, and it explains something that otherwise looks broken.
Reading a low count on a token that nearly doubled
The tokenized MicroStrategy row is the worked example. It was up 91.20 percent over ninety days. That is a near double, and it still only carried 8 of 15.
Two things produced that. First, the ninety day move, which is the impressive number, contributes nothing to the count. Second, on the windows that do count, the asset was ordinary: it lost every one of the five contests on the day, because it was down 0.22 percent while all five benchmarks were up, and it lost to Ethereum on both the week and the month.
So a low count next to a large ninety day figure is not a contradiction and it is not an error. It is the board telling you that the move is old. The asset made its money earlier in the window and has since been keeping pace at best. If your holding period is the next few weeks, the count is describing the part of the history you are about to live in, and the ninety day column is describing the part you missed.
The reverse case is worth the same attention. Eesee carried 12 of 15 at capture, which looks like broad strength, but its seven day return was plus 3.40 percent against Bitcoin at 21.87, Ethereum at 29.22 and Solana at 24.89. It lost all three crypto contests on the week. The twelve came from a strong day and a strong month wrapped around a weak week. A high count is an average of fifteen answers and it can hide a bad one.
What to actually do with the column this week
Use the count as a filter and the return columns as the read. Concretely, when a token catches your eye on the board, do three things in order before anything else.
Check the panel first and write down the strongest of the five benchmarks over your intended holding period. That number, not bitcoin, is what the position has to beat to be worth holding instead of the obvious alternative. Then look at the count and the 90D column together: a high count with a modest ninety day figure is a token that is working now, and a low count with a huge ninety day figure is a token that worked before you got here. Finally, look at the seven day return against the three crypto benchmarks on the panel, because that single comparison tells you whether the strength is current or is being carried by the monthly window.
The uncomfortable version of all this is that on a strong crypto tape, holding an altcoin that fails to clear Ethereum is a decision to earn less than you would have by holding Ethereum, at more risk and less liquidity. The count exists to make that comparison unavoidable, which is exactly why it is worth reading before the price chart rather than after.