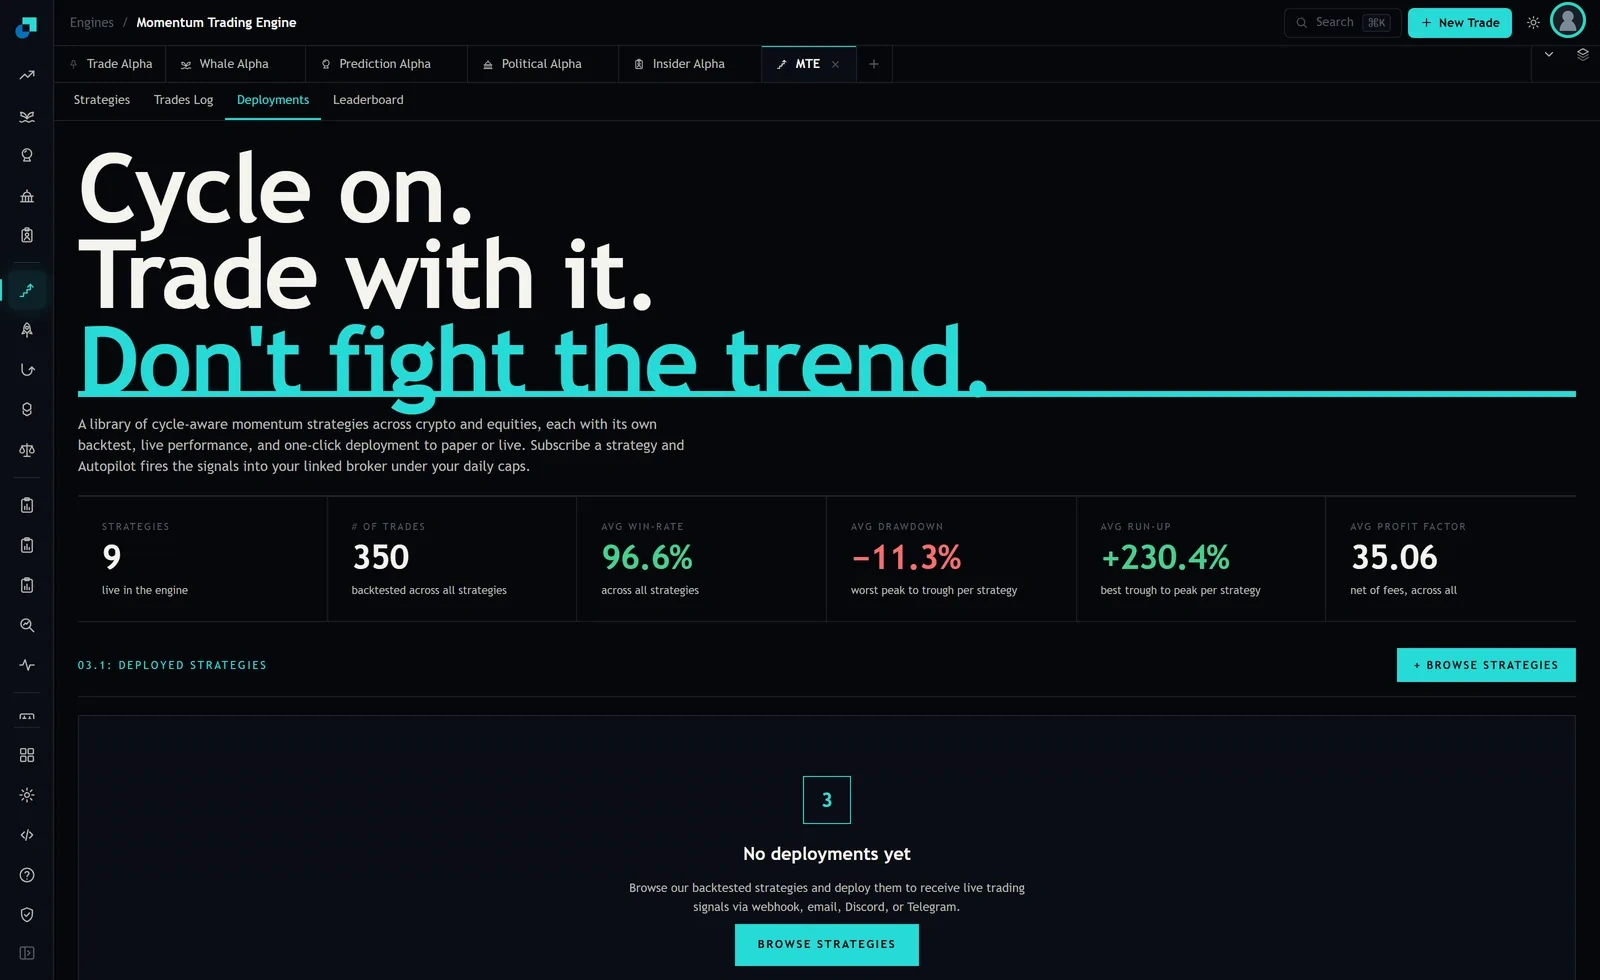
Nothing on a deployment screen tells you how much money a strategy can hold. The Momentum Trading Engine's deployments tab offers a browse control, a list of deployed strategies and a set of delivery channels covering webhook, email, Discord and Telegram. It is a signal distribution surface. It is not, and does not claim to be, a capacity statement, and the absence is not a criticism of the product. No vendor knows your fill quality, your venue access or your position count.
So the number has to be built. It takes three inputs, all of which are either in the trade log or on a market data terminal, and it produces two ceilings. The binding one is whichever is smaller, and which one binds tells you something useful about whether the strategy is capacity constrained by liquidity or by its own trading frequency.
The three inputs and where each comes from
The first is holding period. The trade log carries a Duration column alongside the entry timestamp and status. At capture an active position in a Ford strategy on a one day timeframe showed a duration of five days and zero hours. Take the median duration across a strategy's closed trades, not the mean, because a few long holds will drag a mean upward and overstate the time you have to work an order.
The second is turnover, which follows from the first. The engine reports 350 trades backtested across all strategies with nine live, roughly 39 trades per strategy. A five day median hold implies something near fifty round trips a year if the strategy is close to continuously invested, so 39 trades is under a year of history for a strategy of that shape. Frequency also varies enormously inside the library. The published configurations include strategies running on one day bars and others on sixty and thirty minute bars, and a thirty minute strategy has a capacity that is a fraction of its daily-bar sibling for exactly the same rules.
The third is depth, and it is the only one the platform cannot give you. You need median daily dollar volume for each instrument the strategy trades, taken over the same window as the backtest and not over the last month. Use the median, since a single event day can double a mean.
The participation ceiling
The first constraint is mechanical. You cannot be a large fraction of the day's volume without becoming the day's volume, and most desks cap participation somewhere near ten percent.
You also cannot spend the whole holding period building the position, because then you are still buying when the exit fires. A reasonable working rule is that entry and exit each get a quarter of the median holding period. With a five day median hold, that is one and a quarter days of execution on each side.
Put it together. A ten percent participation cap on an instrument with forty million dollars of median daily volume, worked over one and a quarter days, gives a maximum position of five million dollars. That is the participation ceiling for one name.
Scale it to a book by multiplying by the number of positions the strategy holds concurrently. The trade log makes this observable, since it separates active from closed trades and at capture noted that six strategies were holding nothing. Count the maximum concurrent positions across the history, not the average, because your capacity has to survive the day the strategy is fully invested.
The impact ceiling, which usually binds first
The second constraint is economic rather than mechanical, and it is the one that decides whether the strategy is still worth running at size. Impact on a worked order rises roughly with the square root of the fraction of volume you consume, scaled by the instrument's daily volatility.
Set it up as an inequality. You are willing to surrender some fraction of the strategy's per-trade edge to execution, round trip. Solve for the size at which round trip impact equals that fraction, and you have the impact ceiling.
Worked, on the same instrument. Daily volatility of 250 basis points, an impact coefficient of one, and a strategy with an expected 150 basis points per trade of which you will give up a quarter. The permitted one way impact is about 19 basis points, which corresponds to consuming roughly half a percent of the volume you execute against. Against forty million dollars of daily volume worked over one and a quarter days, that is a position of about 280,000 dollars. The impact ceiling is smaller than the participation ceiling by more than an order of magnitude.
Now change one input. A strategy with 400 basis points of per-trade edge, surrendering a third of it, permits roughly 66 basis points of one way impact and a position near fourteen million dollars, at which point participation binds first at five million. That flip is the useful output of the exercise. A high frequency, low edge per trade strategy is impact constrained and its capacity is small. A slower strategy with a large edge per trade is participation constrained and its capacity is set by how patient you are willing to be.
One number per instrument, not one per strategy
The library spans crypto spot and futures, US equities, forex and commodities. The trade log at capture showed positions on a large US listed equity and on silver spot, and the published configurations included a Solana perpetual, a mid-cap decentralised finance token and a US equity. Those instruments do not sit within an order of magnitude of each other on depth, and a single capacity figure for a strategy that trades several of them is meaningless.
Compute the ceiling per instrument and take the minimum across the instruments the strategy actually holds. Then check the concentration. If a strategy's capacity is set by its thinnest name and that name is a small fraction of its trades, you may be able to carve the instrument out of the deployment and raise the ceiling substantially. That is a decision worth making explicitly rather than discovering when a fill comes back forty basis points wide.
Perpetual futures need separate treatment. One published configuration ran at leverage two, and on a perpetual your capacity is bounded by open interest and funding rather than by spot depth. A position large relative to open interest moves funding against you for as long as you hold it, which is a cost that scales with time rather than with turnover and does not appear anywhere in an impact model.
The size at which a published backtest stops describing you
Everything above produces a number. The last step is to state what that number means, because a capacity ceiling is not a limit beyond which the strategy stops working. It is the size beyond which the published track record no longer describes your experience.
The backtest assumed a fill. At a position of 280,000 dollars in the worked example, that assumption is roughly right and the historical statistics are a fair guide. At five million it is wrong by tens of basis points per trade, and with fifty round trips a year that is several hundred basis points of annual drag that appears nowhere in the vendor's numbers. At twenty million the strategy is trading against itself and the historical record has no bearing on the outcome.
Write the ceiling into the deployment as a hard position limit at the point of sizing, not into the memo as a caveat. Set it at the minimum of the two ceilings, review it when median volume in any held instrument falls by a third, and record the per-trade edge you assumed, because that assumption is the input the whole calculation is most sensitive to and it is the one most likely to have been optimistic.