A cluster of insider buys in a name that trades four hundred thousand dollars a day is a trade idea for a person, not for a fund. That is not a claim about the quality of the signal. It is about the two numbers that decide whether the signal is available to you at all, the dollars you need to deploy for the position to matter and the dollars the tape can absorb before you become the tape. Capacity belongs at the front of a cluster strategy, before hit rates, because it determines which half of the signal list you are permitted to look at.
At the time of writing the Insider Alpha header strip showed 312 multi-insider clusters over the trailing seven days, with the buy side of the filing feed carrying 134.32 M USD against 2.19 B USD of selling and a sentiment reading of 18 percent. Three hundred clusters a week sounds like a supply problem solved. It is not. Supply measured in signals is not supply measured in deployable dollars, and the mapping between the two is brutal in exactly the size range where clusters look most attractive.
What the cluster grid reports and what it leaves out
Each card in the grid carries a ticker, a company, a direction, an insider count and a net value. The one on screen at capture read SCTX, Scribe Therapeutics, BUY, four insiders, 71.26 M USD net value. That is the full set of fields, and it is worth being precise about what is missing from it. There is no average daily volume, no free float, no shares outstanding, no short interest and no spread. Every quantity that determines whether you can own the position is absent from the card that is telling you to want it.
There is a second lesson in the grid as I captured it. The same card repeated across the visible rows, which is a rendering state rather than a market state, and worth catching before a screen becomes an input to a model.
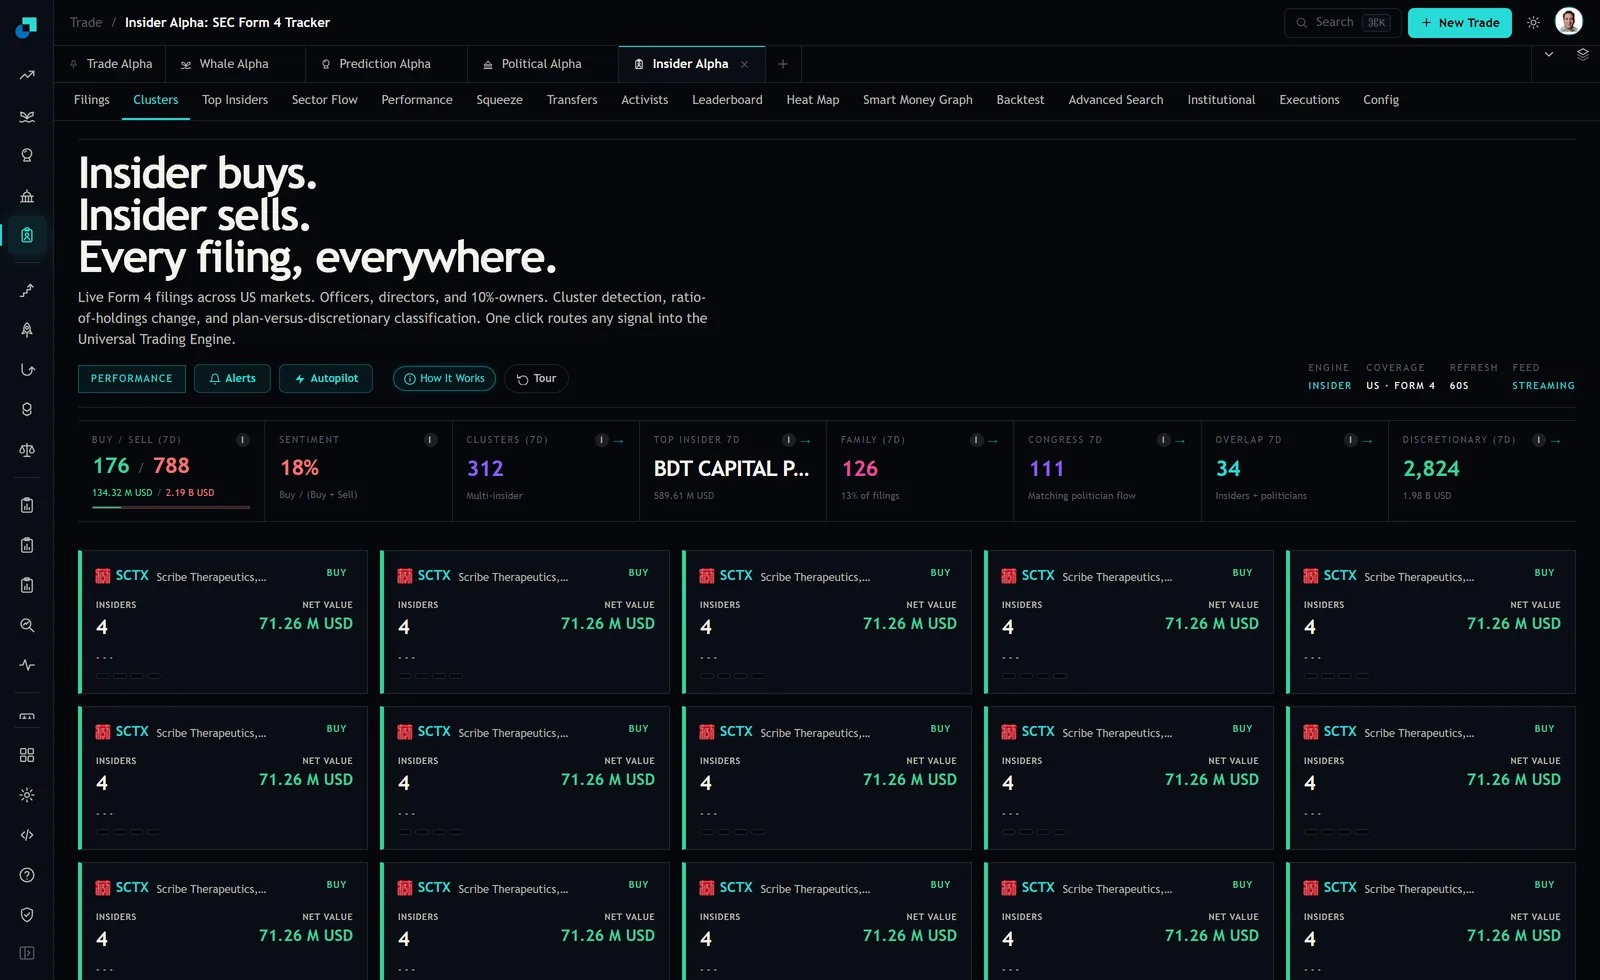
The header copy above the strip promises that one click routes any signal into the trading engine, which is true of the plumbing and silent on capacity. The distance between how fast a signal reaches an order and how slowly that order can be worked is where this strategy family does most of its damage.
Participation arithmetic decides the position, not the signal
Fix a participation cap first, because it is the only lever you control. Take ten percent of average daily volume as the ceiling and three days as the window in which the entry has to be complete, on the reasonable view that a cluster signal decays and a fill spread over three weeks is a different strategy from the one you tested. Those two choices produce a hard dollar number per name, and the number is smaller than people expect.
| Name ADV | Max entry at 10 percent over 3 days | Position as bps of a 400m book |
|---|---|---|
| 250k USD | 75k USD | 1.9 bps |
| 1m USD | 300k USD | 7.5 bps |
| 5m USD | 1.5m USD | 37.5 bps |
| 25m USD | 7.5m USD | 188 bps |
Now invert it. Decide the smallest position that is worth the research, the risk line and the review it will generate. If that number is 25 bps, on a 400 million dollar book it is one million dollars, and at ten percent of ADV over three days it requires roughly 3.3 million dollars a day of volume. That is your eligibility floor, derived from your own book rather than from anything on the screen, and it is the single most useful number to compute before you look at another cluster. Everything below it is research you cannot act on.
Then apply the same arithmetic to the exit, which is where the strategy actually fails. Entry happens into a name that insiders have just bid for, often with a print already on the tape. Exit happens when the thesis breaks, which is to say into weakness, alongside anyone else running the same screen. A three day entry window and a three day exit window are not symmetric in cost, and if your capacity work only models the buy you have modelled the easy half.
Free float is the constraint that binds before volume does
Average daily volume is the flow constraint. Free float is the stock constraint, and in the names where clusters cluster it binds first. A company whose officers, directors and sponsors hold a large share of the register has a tradable float well below its shares outstanding, and a cluster is by construction an event in which insiders take more of that float out of circulation. The signal and the illiquidity have the same cause.
Two consequences follow for a desk rather than for an individual. The first is your own disclosure boundary. Position sizes that would be trivial in a large cap can put you across ownership thresholds in a micro cap, at which point you acquire a filing obligation, a public position and a much slower exit. The module's activist view is built around exactly these forms, with filters for 13D, 13D amendments, 13G and tender offers, and an intent filter separating activist from passive. If you would not be comfortable appearing on that screen yourself, the position size that gets you there is your ceiling regardless of what the liquidity table says.
The second is crowding. A published, screenable signal in a thin name has a concentrated audience, and the whole audience sees it in the same sixty second refresh window. Your capacity estimate assumes you are the only participant working ten percent of volume. On the days that assumption is worst is precisely when the signal fired, so measure realised participation after the fact rather than assuming the plan held.
The join the module does not do for you
Be plain about this, because it changes the workflow. The filter controls I could confirm on the captured screens are window length, direction, and trade value buckets at 25k, 100k, 500k and one million dollars on the performance view, plus form and intent filters on the activist view. I did not see a control anywhere that filters or sorts clusters by average daily volume, free float or market capitalisation. If one exists it was not on the screens I read, so I will not tell you it is there.
Which means the eligibility join is yours to build. The cluster list arrives with a ticker, and your own security master already carries ADV, float and borrow. One join, one boolean column, and the strategy stops being a feed and starts being a universe. Recompute it weekly, because ADV in small caps is not stable, and a name that cleared your floor during a hot month will not clear it in August.
One more honesty note about measurement before you calibrate any of this. At capture the forward return attribution view reported 20,000 scored filings at the seven day horizon, with a plus 0.25 percent average return against plus 0.07 percent for SPY and a 46 percent win rate, while the 30 day, 90 day and 365 day panels each showed zero scored filings. Whatever holding period your capacity model assumes, that panel could not confirm it on the day, and a capacity plan built on a horizon you have not measured is a plan built on a preference.
The capacity number that belongs in the strategy document
Write the ceiling down as a dollar amount, not as an adjective. The form that survives an investment committee is arithmetic anyone can rerun. Take the count of names per quarter that clear your ADV floor, multiply by the maximum position that floor permits, and divide by your average holding period in quarters to get a rough deployed capital figure. If that number is below the allocation the strategy has been given, you have two choices and both need stating. Lower the floor and accept worse execution, measured and attributed, or cap the allocation and tell the committee the strategy is capacity constrained rather than letting it silently drift into names it cannot hold.
Then instrument it. Log the ADV multiple and the realised participation rate at entry for every position, alongside the fill price against the arrival price. When a position goes wrong, and some will, the review question is not whether the insiders were right. It is whether you were paid for the illiquidity you took on, and the only way to answer that in a meeting is to have recorded the illiquidity at the moment you accepted it.