Every event contract book I have looked at closely concentrated somewhere its mandate never mentioned. Not because anyone decided to, but because the screener sorted by 24 hour volume, the top of that sort was sports, and the desk worked from the top. Six weeks later the exposure report says the book is a sports book with a politics label on it.
The fix is not a rule about what to trade. It is a budget denominated in the thing that actually binds, which is how much resting depth you are willing to be in each category, and it has to be built before the screener is opened rather than reconstructed afterwards from fills.
A listing count is not a capacity estimate
The Prediction Alpha stats tab gives you the taxonomy in one bar chart, twenty buckets ranked by market count. Reading it down from the top: Sports 47,154, Other 33,257, Politics 12,898, Tech 4,610, Elections 4,164, Geopolitics 3,083, Crypto 2,822, Finance 2,255, Culture 1,510, Entertainment 1,325, then a tail running from Economics at 727 down to four buckets holding fewer than thirty listings each.
If you allocate proportionally to that distribution you have built a sports fund. Sports is over forty percent of the universe by count, and the reason is structural rather than economic: every fixture, every leg, every game inside a series is its own listing. Volume follows the same shape. On the trending tab's 24 hour volume board as captured, nine of the ten rows were sports or esports fixtures, and three of those ten were the same match sliced into Game 1, Game 2 and the series result.
Meanwhile the deepest single books on the platform sat in politics. The most liquid leaderboard topped out at $4.7M, and all ten of its rows were legs of one long dated nominee market on one venue. So the count distribution and the depth distribution point in opposite directions, and only one of them is a constraint on your book.
Nearly a third of the taxonomy has no name
The second largest bucket in the category chart is Other, at 33,257 listings. That is close to twenty nine percent of the categorised universe sitting in a bucket that tells you nothing about what is in it.
This is not a rounding problem you can ignore in a risk document. A category budget with a twenty nine percent unlabelled residual is a budget with a hole in it, and the hole will fill with whatever the screener surfaces. The same chart shows why the residual exists: the twenty buckets include Finance and Financials, Economics and Economy and Business, Tech and Science and Technology, Climate and Weather and Environment and Climate. Those are six venues' internal vocabularies merged into one list, and anything that did not map cleanly landed in Other.
Two consequences for the budget. First, define your own category boundaries in the risk document and map the platform's labels onto yours, rather than inheriting a taxonomy that was assembled by data engineering rather than by risk. Second, treat Other as a category with its own explicit limit, because unallocated is not the same as zero and pretending otherwise is how the limit gets breached without anyone breaching a limit.
Write the budget in participation, not in notional
A notional limit per category is the wrong instrument here because it assumes dollars are fungible across books, and on this asset class they are not. Four adjacent rows on the markets tab carried Liquidity readings of $497.3K, $686, $648.8K and $282.0K. A $100,000 limit is invisible against three of those and impossible against the fourth. The mean of that set is a number with no operational meaning.
So express the budget as a participation rate against observable resting depth, and let the notional fall out of it.
- Set a maximum share of visible book per contract. Whatever rate you choose, choose it once and write it down, because it is the number that will be questioned in review after a bad exit.
- Compute per contract capacity as that rate applied to the thinner side of what you can actually observe, not to a headline liquidity figure.
- Sum capacity across the contracts in a category that clear your eligibility gates, and that sum, not your appetite, is the category's ceiling.
- Set the allocation as the lesser of the mandate weight and the measured ceiling. Where the ceiling binds, record it, because a persistently binding ceiling is information about the strategy rather than an administrative detail.
The output of that exercise is usually uncomfortable. Categories that look enormous by listing count deliver small ceilings because their depth sits in a long thin tail, and categories with a handful of contracts deliver most of the usable capacity. That is the correct answer, and the whole point of doing it in advance is that you learn it before the book does.
The five liquidity buckets and what the bottom of them is for
The stats tab splits the universe into five liquidity bands, at zero, one to ten thousand, ten to one hundred thousand, one hundred thousand to a million, and a million and above. The bar counts run from 41,079 listings in the tallest band down to 204 in the shortest. The exact allocation across the five is worth reading off the panel yourself, per category, using the venue filter chips at the top of the page, because that per category read is the entire input to the budget.
What to do with the result is simpler than it looks. The bottom two bands are not a capacity source at any institutional size, and the honest treatment is to exclude them from the budget rather than to discount them. A contract with a four figure book does not become tradable because you sized down; it becomes a position you cannot exit without paying for the privilege of having entered. Excluding them also does something useful to the count: it collapses a universe of tens of thousands of listings into a named, finite list of contracts you can actually deploy into, and that list is short enough to review one row at a time.
The top band deserves its own caution. A million dollar book is deep for this asset class and thin for most others, and the ten deepest rows in the capture were legs of a single event. Concentration inside a category is as real as concentration across them, so the budget needs a per event limit sitting underneath the per category one, or one nominee market becomes your entire politics allocation.
Re-measure on the cadence the listing curve forces
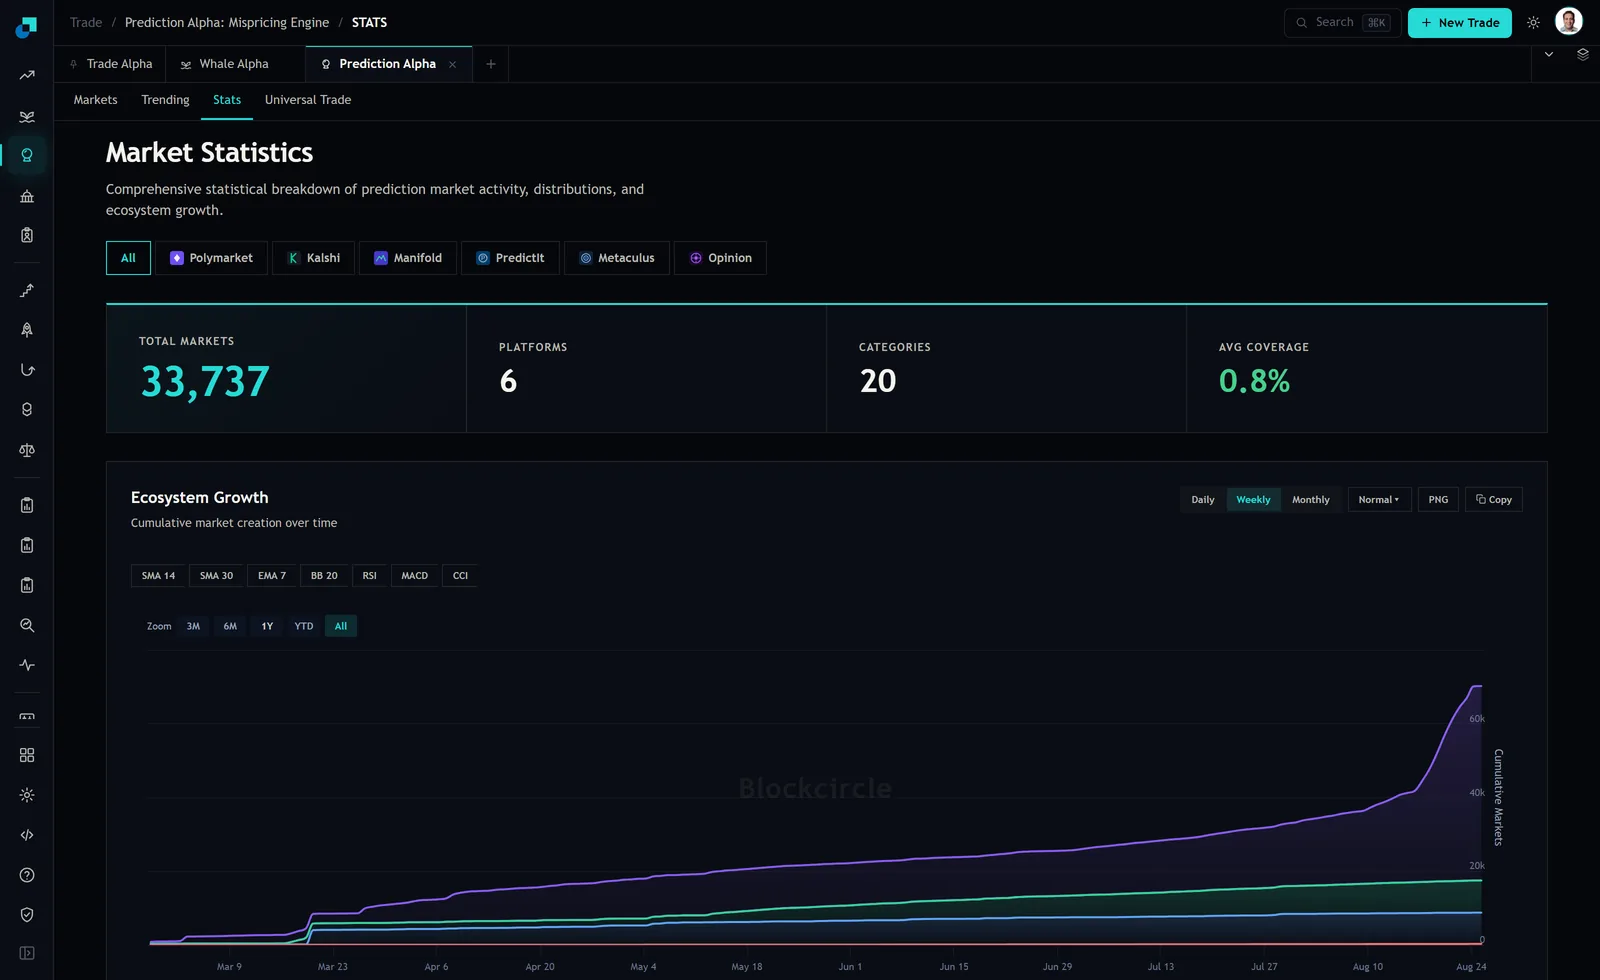
The ecosystem growth panel on the same page plots cumulative market creation on a window that opens on 9 March 2026, and the leading series clears sixty thousand by 24 August, with the steepest section in the final weeks of the window. Whatever the exact slope, the supply of listings in this asset class is not stationary, and the composition is not either.
A depth budget measured once and left alone therefore decays in a specific and predictable direction. New listings arrive faster than new capital does, so average depth per contract drifts down while your ceilings, computed against last quarter's books, stay where you left them. The budget becomes progressively more permissive exactly as the universe becomes progressively thinner.
Quarterly re-measurement is the minimum, and there is a cheap monthly version worth running in between: re-read the liquidity histogram per category, and if the share of listings in your two eligible bands has moved by more than a few points, pull the full measurement forward. Archive each reading with its date and its filter settings, because the value of this exercise compounds. One reading gives you a budget. Four readings give you a view on whether the capacity in a category is growing or being competed away, and that is the question the investment committee will eventually ask.