Two strategies, one ticker, and one of them has a clearly better record. The instinct is to conclude that the better one is better. The more common truth is duller: they were alive during different stretches of market, and the one that looks good was running when the instrument was going up.
This is not a subtle statistical point. It is arithmetic about what a percentage return is measured over, and it decides most side-by-side comparisons before any of the clever columns get a look in. The engine gives you a Compare action in the header row of its Strategies tab, and whatever tool you use to line two records up next to each other, the shared-period problem is yours to solve first.
The columns are not on a common clock
The strategies table shows Strategy, Symbol, Name, Type, TF, Win %, Return %, Alpha %, Trades, Sharpe, PF, Max DD and B and H DD. Nothing in that list is a start date, and nothing is an end date. Every percentage on the row is computed over a window the table does not name.
Which means the Return % column is not comparable across rows unless you have separately established that the windows match. A strategy showing +296.57% and one showing +152.14% may differ in quality, or one may simply have been running for twice as long. On the visible rows at capture, three strategies showed 32, 26 and 26 trades. Different trade counts are consistent with different activity levels over one window, and equally consistent with the same activity over different windows, and the table does not distinguish between those two stories.
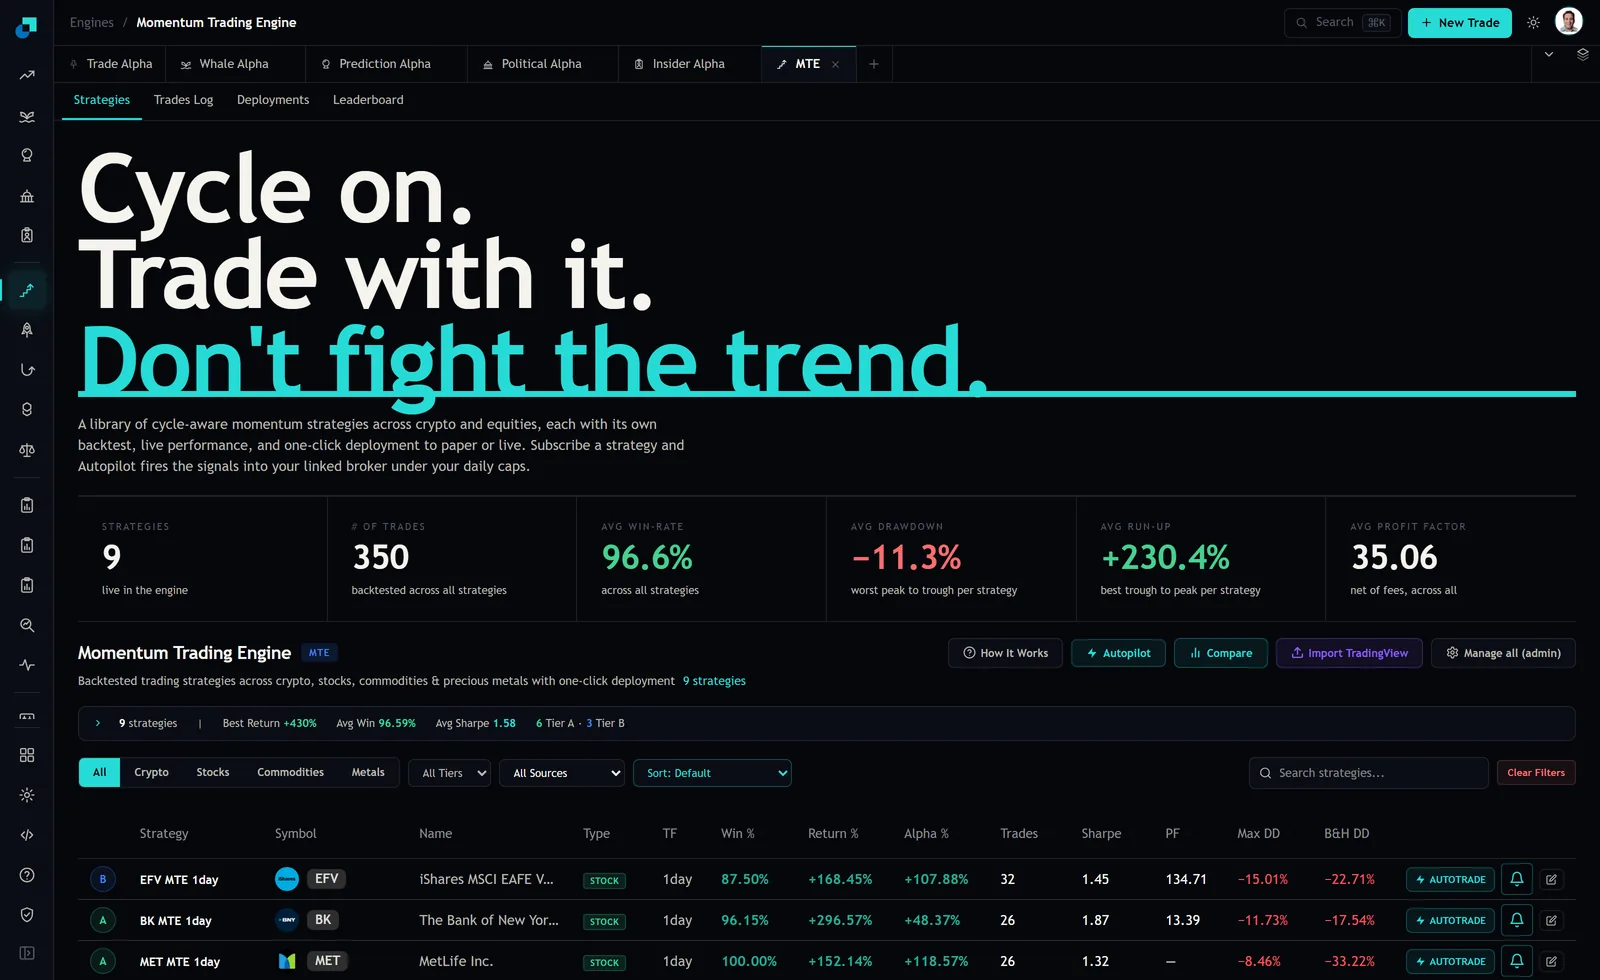
The window check that is already sitting in the table
That last column is more useful than it looks. Buy and hold drawdown is a property of the instrument over the strategy's window. It has nothing to do with the strategy's rules.
So put two strategies on the same symbol side by side and compare their buy-and-hold drawdown figures. If they match, the two ran over the same stretch and their returns are on a common clock. If they differ, they did not, and everything else on the two rows is describing different periods. That is a free window check, it takes ten seconds, and it comes before any comparison of the actual performance columns.
It is worth being precise about what it does not prove. Two windows can produce the same buy-and-hold drawdown while differing at the edges, so matching values are a strong hint rather than a certificate. Divergent values, though, are conclusive: those strategies did not run over the same market.
Forcing the periods to line up
When the windows differ, the fix is to truncate rather than to compensate. Find the later of the two start dates, cut both records to begin there, and recompute from the trades.
The trades log is where you do this, because it carries a Time column stamped in UTC on every row along with Entry, Current, PnL, Run-up, Drawdown and Duration. Filter to the strategy, sort by time, drop everything before the shared start, and add up what is left.
Two exclusions before you add anything up. The log at capture carried an amber banner stating that 44 of the rows below had been reconstructed by replaying the strategy over historical candles, with no order placed and no fill occurring for them. Those are simulations sitting in a table of trades and they must come out of a comparison that claims to be about what happened. And one row was tagged Manual on its closed status, a long in Nordex SE entered at 20.80 USD and closed at 19.30 for -7.21%. A manually closed trade is evidence about a person, not about the strategy, and it belongs in its own bucket.
What to compare once the clocks match
Total return is the least informative thing you can look at, and it is the first thing everyone looks at. Four better comparisons, all computable from the log.
- Trade count over the shared window. More trades is not better performance, but it is more evidence, and on a two-month forward test the strategy that produced twelve observations has told you considerably more than the one that produced three.
- Concentration of the result. Sum the top three trades and divide by the total. If half the return came from three trades out of twenty-six, you are comparing luck rather than method, and the ranking will reverse the next time one of those three does not show up.
- The worst run rather than the worst trade. Count the longest sequence of consecutive losers. That number, not the drawdown percentage, is what decides whether you will still be running the thing when it matters.
- Whether the loss profile is real. One row at capture showed a 100.00% win rate on 26 trades with a blank in the profit factor column. A blank profit factor is what a sample with no losing trade looks like, and a divisor of zero is not a strategy that cannot lose, it is a strategy that has not lost yet in twenty-six attempts.
The only comparison neither strategy could have been fitted to
Everything above is archaeology on a record that already exists. The record was, at minimum, selected: it is in the library because it looked good. So run both candidates forward in paper over a shared window, starting now, and compare them on that.
The forward window is the one stretch of time where neither strategy had any opportunity to be chosen for its performance. It costs you nothing but patience, both strategies face the same market, and the comparison needs no truncation because you started them together.
Give it enough time to contain roughly twenty trades from the slower of the two, which for a 1day strategy holding a few days is a couple of months. Then pick, and pick on the four comparisons above rather than on which line is higher. And when you look back at the engine's summary tiles while you wait, treat the 96.6% average win rate and the 35.06 average profit factor for what they are: aggregates across nine strategies over 350 backtested trades in total, about thirty-nine trades apiece, computed before your slippage, your delay in placing the order and your tax. They are context for a library, not a forecast for either candidate.