The standard research output on event contracts is a percentage. The model says 60, the screen says 52, therefore there is an eight point mispricing, therefore we should do something about it. That output cannot be allocated against, because nobody in an allocation meeting can act on a percentage without knowing how many dollars fit through it, and the answer is almost never the number in the Liquidity column.
Converting a spread into a capacity figure is mechanical work and it takes about ten minutes per opportunity. The reason to do it is not rigour for its own sake. It is that the ranking of your opportunity set changes, usually completely, once you rank by deployable dollars rather than by spread width.
Walk the book, do not read the top of it
The metric you want is a depth-integrated edge. Take your fair value, walk down the offers, and accumulate contracts level by level while the per-contract edge at that level still clears your hurdle. The hurdle is not zero. It has to cover the venue fee, the expected cost of exiting early if you have to, and a haircut for the possibility that the size you are lifting knows something.
Two numbers fall out of the walk. The deployable notional, which is the sum of size times price across the levels you took. And the dollar edge, which is the sum of size times the difference between your fair value and each level price. The second number is the one that goes in the memo. The first is the one that tells you whether the position is worth the operational overhead of holding it.
Work an illustrative book so the mechanics are visible. Assume your fair value is 60 and the offers stack as five thousand contracts at 52, eight thousand at 55, twenty thousand at 58 and forty thousand at 59.5. Set the hurdle at two points per contract.
The walk, and what it does to the headline
| Level | Size | Edge per contract | Notional | Dollar edge |
|---|---|---|---|---|
| 52 | 5,000 | 8 points | $2,600 | $400 |
| 55 | 8,000 | 5 points | $4,400 | $400 |
| 58 | 20,000 | 2 points | $11,600 | $400 |
| 59.5 | 40,000 | 0.5 points | excluded | excluded |
Deployable notional is $18,600 and the dollar edge is $1,200, which is 6.5 percent on committed capital. The headline eight point mispricing was a fifteen percent edge on the top-of-book price. The achievable blended figure is less than half that, and the fourth level, which held more size than the first three combined, contributed nothing because it sat inside the hurdle.
That last point is the one worth internalising. Depth is not fungible with edge. A market can be deep and still have almost no capacity at your price, because the depth sits exactly where you have no reason to trade. This is why a scalar liquidity figure cannot answer the sizing question no matter how large it is.
Rank by dollars, then apply a floor
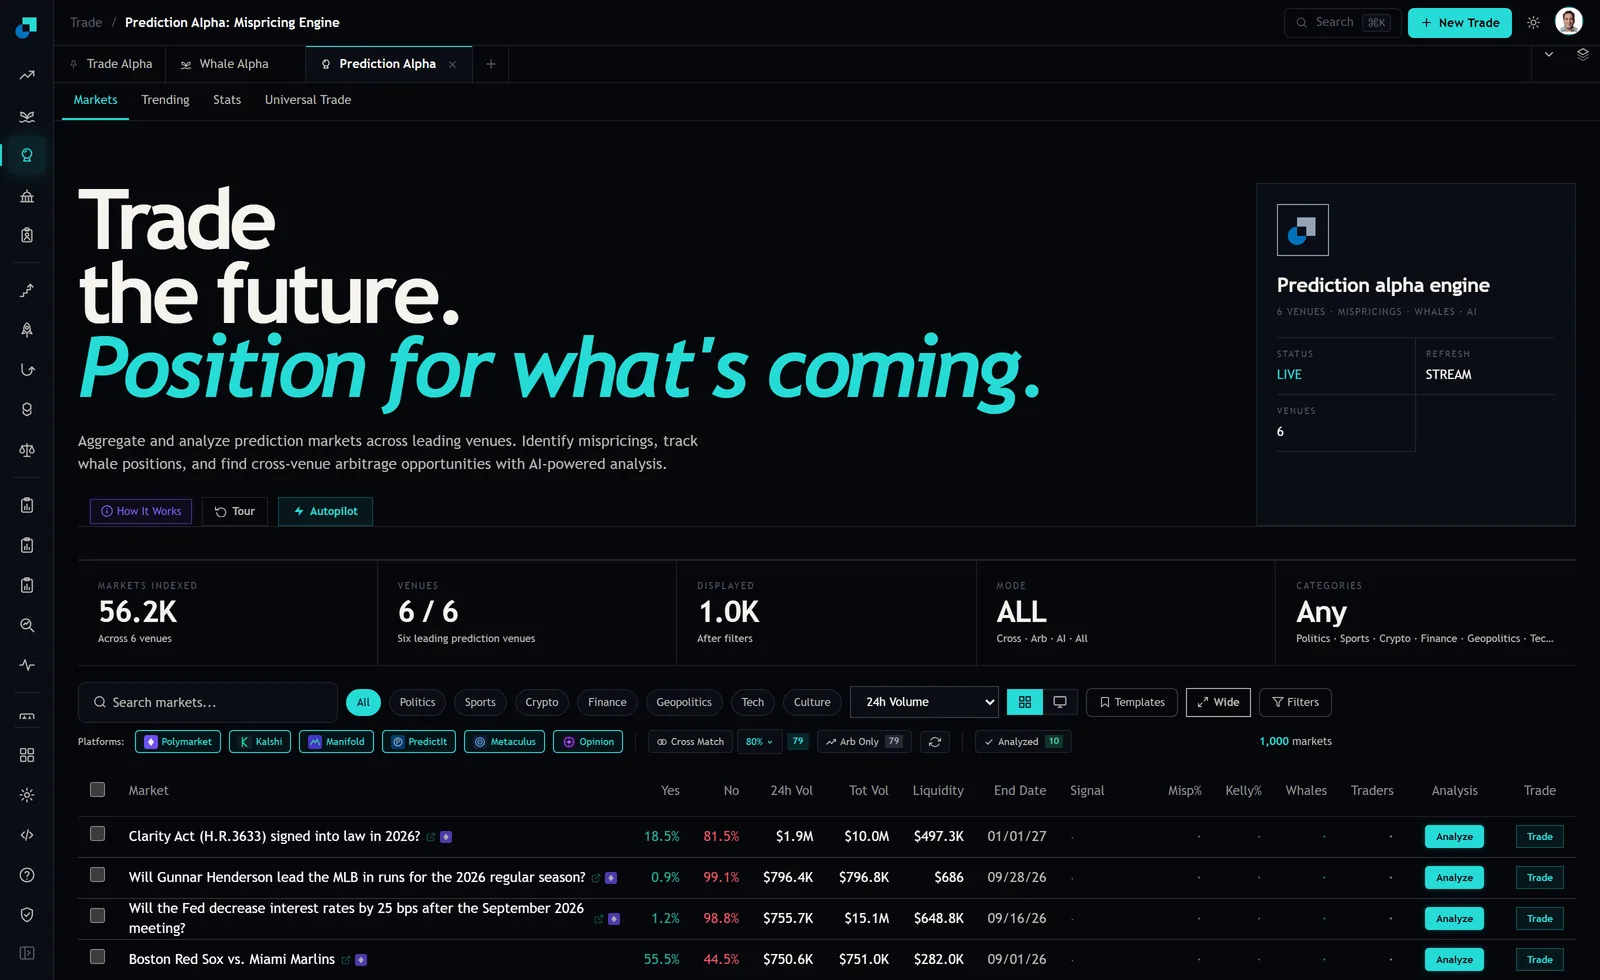
Now run the same walk across the opportunity set and rank twice. Ranked by spread width, thin markets dominate, because a market with almost nothing resting can display an enormous apparent mispricing and nobody has an incentive to correct it. On the markets tab the row with a Liquidity figure of $686 would sit at the top of a spread-ranked list and is uninvestable at institutional size at any spread. Ranked by dollar edge, that row disappears and the deep rows rise.
Percentages flatter small trades, and annualising makes it worse. The illustrative position above returns 6.5 percent on committed capital. If it resolves in three weeks, that annualises to something north of a hundred percent, which will get a nod in a meeting and is close to meaningless, because the whole trade earns twelve hundred dollars. Report both, but lead with the dollar figure, and require the annualised number to be accompanied by it.
Then set a minimum ticket and enforce it. Price your own cost to open, monitor, document and settle a position. Analyst time to verify the resolution criteria, operations time for funding and settlement, the compliance record, the marking work at each month end while it is open. Whatever that number is at your firm, the dollar edge has to cover it by a comfortable multiple before the position is worth taking. A twelve hundred dollar edge does not clear the bar at most institutions, and knowing that before the research is written saves more time than the trade would have made.
Time to resolution is a sizing input, not a footnote
Event contracts hold your capital until they settle, and the End Date column is where you check the term. On the markets tab, four rows near the top of the same volume sort carry end dates of 01/01/27, 09/28/26, 09/16/26 and 09/01/26. Observed in late August, that is a range from a few days to more than four months, sitting side by side in a table that gives all four the same visual weight.
The same dollar edge across those tenors is four completely different allocations. There is no early exit that you should rely on, because the exit is the same order book you just walked, in the other direction, on a day you do not choose. Size as though the capital is locked, because for practical purposes it is.
The two-leg case tightens this further. If the position is a matched pair across venues, capacity is the minimum of the two books walked to your hurdle, not the average and certainly not the larger. Both legs are funded in full, there is no netting across venues, and if the two contracts settle on different dates you carry a naked leg in between. That gap belongs in the sizing, not in the risk appendix.
The haircut for who is on the other side
The walk above treats resting size as passive inventory waiting to be lifted. Some of it is. Some of it is a quote from someone who has read the resolution criteria more carefully than you have, and the fraction that is informed rises as you approach the settlement date and as the question gets more specialised.
You can handle that in either of two places. Shift your fair value estimate toward the book by a couple of points before you walk, or raise the hurdle. I prefer raising the hurdle, because it keeps the fair value honest and confines the adjustment to a single parameter you can vary and defend. Either way, write down which one you did, because a depth-integrated edge computed without a haircut and one computed with it will differ by enough to change the ranking, and the version that ends up in the memo should be the version somebody chose deliberately.
The output that belongs in front of an allocator is one line per opportunity. Deployable notional, dollar edge, edge on committed capital, days to resolution, the annualised figure, and the name of the constraint that binds, which will be depth, or hurdle, or tenor, or minimum ticket. When the constraint is named, the follow-up question stops being how confident you are in the model and becomes whether the constraint can be moved, which is a question the desk can actually work on.