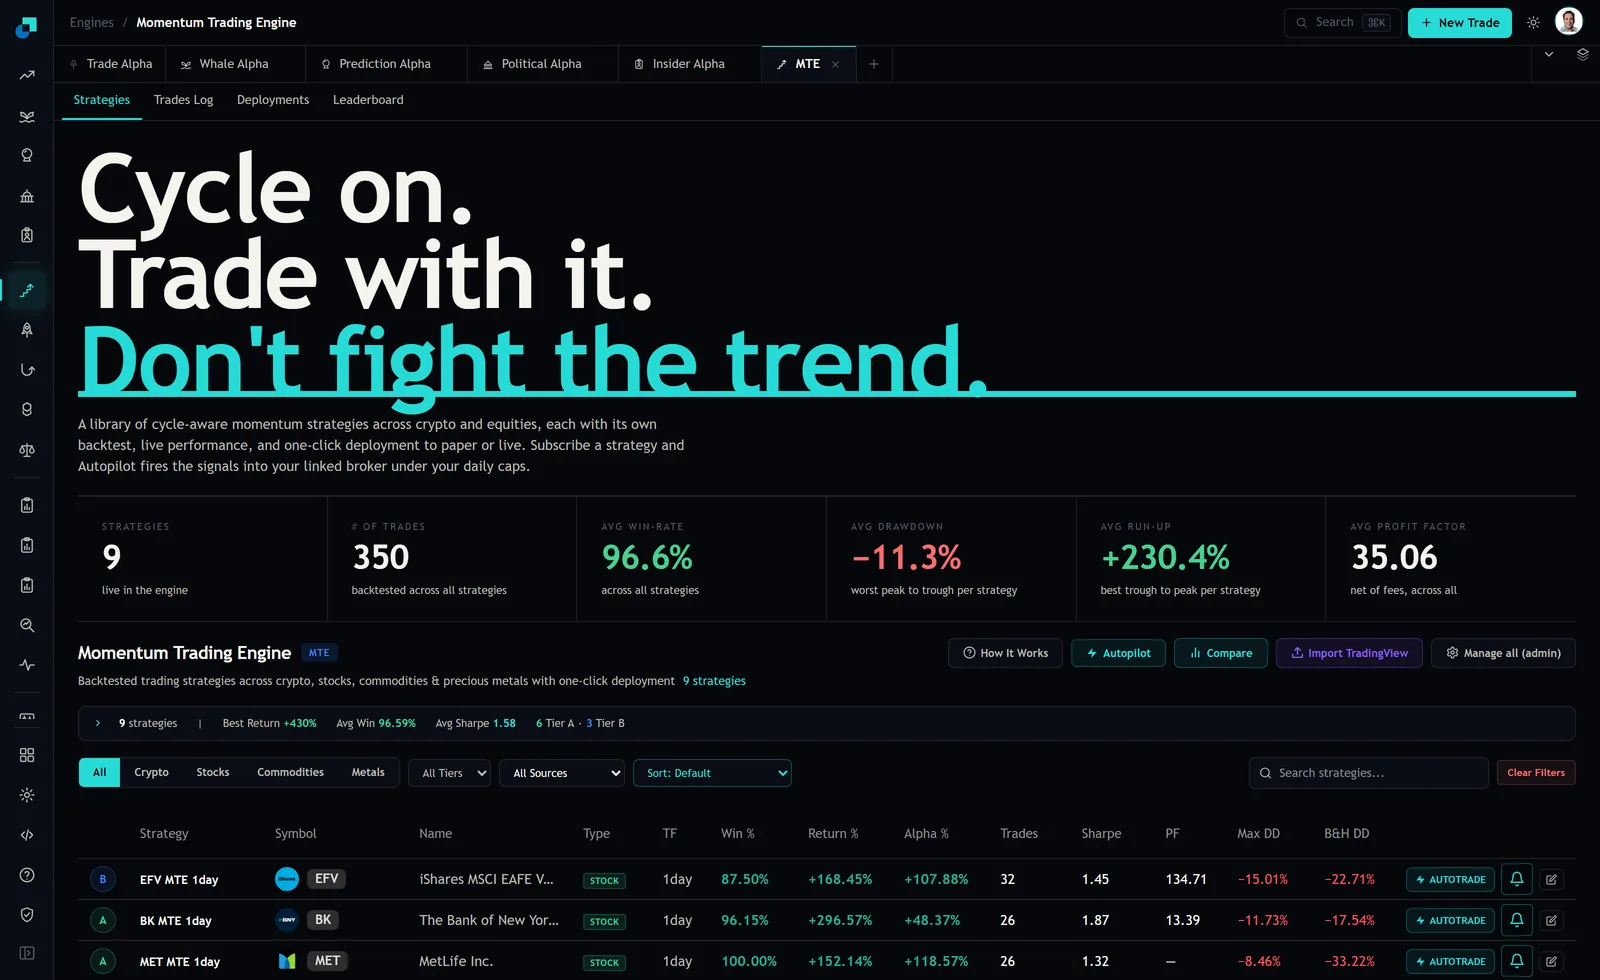
The Momentum Trading Engine header carries an average win rate of 96.6 percent across all strategies. Most people read that and feel reassured. I read it and immediately go looking for the exit rules, because a win rate that high is not a statement about how good the entries are. It is a statement about when the strategy decides a trade is over, and there is a specific arithmetic reason why.
Two tiles on that same header make the case together. Average win rate of 96.6 percent, and average profit factor of 35.06, described as net of fees across all strategies. Hold those two numbers next to each other and you can back out something the engine does not print anywhere, which is the size of the average winner relative to the average loser.
What 96.6 percent and a profit factor of 35 imply together
Profit factor is gross profit divided by gross loss. Write it out and it becomes an equation about trade sizes rather than trade counts. Gross profit is the number of winners times the average winner. Gross loss is the number of losers times the average loser. Rearranged, the ratio of average winner to average loser equals the profit factor multiplied by the ratio of losers to winners.
Put the engine's numbers in. Losers are 3.4 percent of trades, winners 96.6 percent, so the loser to winner ratio is 0.035. Multiply by a profit factor of 35.06 and you get about 1.23. The average winning trade in this library is roughly 1.2 times the size of the average losing trade.
That is the finding, and it runs against everything a momentum system is supposed to look like. Trend following earns its keep by having a low win rate and enormous winners. Something like 40 percent winners at five or six times the size of the losers is the classic shape. What the engine's two tiles describe instead is a library that wins almost every time and wins by very little each time. The edge is entirely in frequency.
The exit design this points at
There is a well-understood way to manufacture a very high win rate, and it is not subtle. Take profit at a small fixed target, and give losses a wide stop or no stop at all. Almost every trade eventually touches a small target, so almost every trade closes green. The losses that do land are the ones where price kept going and never came back, and those are the ones that hurt.
The engine's drawdown and run-up tiles are consistent with exactly this. Average drawdown reads minus 11.3 percent, described as worst peak to trough per strategy. Average run-up reads plus 230.4 percent, described as best trough to peak per strategy. A run-up of 230 percent that does not show up as a comparable average winner means those peaks were not converted into closed profit. The position went up a long way at some point and the strategy took a much smaller amount off the table.
That is the signature of clipping. It is not fraud and it is not a broken engine. It is a design choice with a real cost, and the cost is that your equity curve depends on the small losses staying small, forever.
What a thin sample does to all of this
The engine reports 350 trades backtested across all strategies, spread over nine live strategies. That is roughly 39 trades each, and 39 trades at a 96.6 percent win rate produces about 37.7 winners and 1.3 losers.
Sit with that. The profit factor of 35.06 is a ratio whose denominator is, on average, one or two trades per strategy. One loss of unusual size would move that denominator by a factor of three and drop the profit factor from 35 to something in the low teens. A statistic resting on one observation is not a statistic, it is an anecdote with a decimal point.
Run the other version of the same arithmetic. At a 96.6 percent per-trade win rate, the chance a given strategy shows zero losing trades across 39 attempts is about 26 percent. So of nine strategies, you would expect two or three to display a perfect record purely as a consequence of the sample being short. A perfect record in this library is the expected outcome of not having traded very much yet.
The spread hiding under the average
The header gives you a mean and no dispersion, which is where the average does its real damage. The engine's own published configuration notes show what the individual strategies look like, and they are not clustered.
One equity configuration on a 60 minute timeframe is described with an 80 percent win rate and a 17 percent drawdown. Another on the same ticker at 30 minutes shows 94 percent and 20 percent. A crypto configuration on a Solana perpetual shows 92 percent and 15 percent. One on a Curve pair shows 99 percent and 16 percent. That is a range from 80 to 99, and the 96.6 percent average is being pulled upward by the strategies near the top of it.
The reading that follows is counterintuitive and I think correct. Of those four, the 80 percent configuration is the one I would look at first. A win rate near 80 with a drawdown of 17 percent is a shape that can survive a bad regime, because it already contains losses and the rules have already demonstrated they keep going after them. A 99 percent configuration has not yet shown you what it does when it is wrong.
The columns that settle the question
You do not have to take any of this on inference, because the trade log carries the fields that resolve it. Open the trades tab and the columns include Entry, Current, PnL, Run-up, Drawdown and Duration alongside the direction and timeframe.
Sort the closed trades by PnL and look at the extremes. If your worst three losers are several times the size of your best three winners, the clipping thesis is confirmed and you now know your real risk shape. Then look at Run-up against PnL on the winners. A winner that shows a run-up of 40 percent and a realised PnL of 6 percent gave back 34 points of open profit before the exit fired, and if that pattern repeats across the log, the exit is the constraint on the strategy rather than the entry.
Finally, check Duration on the losers against Duration on the winners. If losers are held three or four times longer, the strategy is doing precisely the thing the win rate hinted at, which is banking small gains quickly and waiting out the bad ones. Whether you are willing to run that is a legitimate question with a real answer either way. What you cannot do is read 96.6 percent off a tile and conclude the strategy is nearly always right.