The Feed tab puts Entry and Current side by side, and the column between your eye and the decision is the PnL one, which is coloured and therefore gets read first. That ordering is backwards. PnL tells you how the whale is doing. Entry against Current tells you what is left for you, and those are different questions with different answers.
On prediction markets the arithmetic is unusually clean, because both numbers are probabilities. A share that resolves pays 100. So the distance a position still has to travel is fully determined by the Current figure, and the distance already travelled is fully determined by the pair.
The two numbers you can compute from the pair
Write them down once and you will never need to think about it again.
The share of the move already gone is the gap between Current and Entry divided by the gap between 100 and Entry. If a whale entered at 47 and the market now trades at 48, that is 1 divided by 53, or 1.9 percent of the journey. Almost everything is still in front of you.
The second number is what you are actually buying. Paying the Current price to receive 100 on resolution means your break-even is the Current price itself, expressed as a probability. Buy at 79 and the event has to happen at least 79 percent of the time for you to come out level before fees. That framing is more useful than a return multiple, because it puts the question in the terms you can argue about: do I believe this happens four times in five.
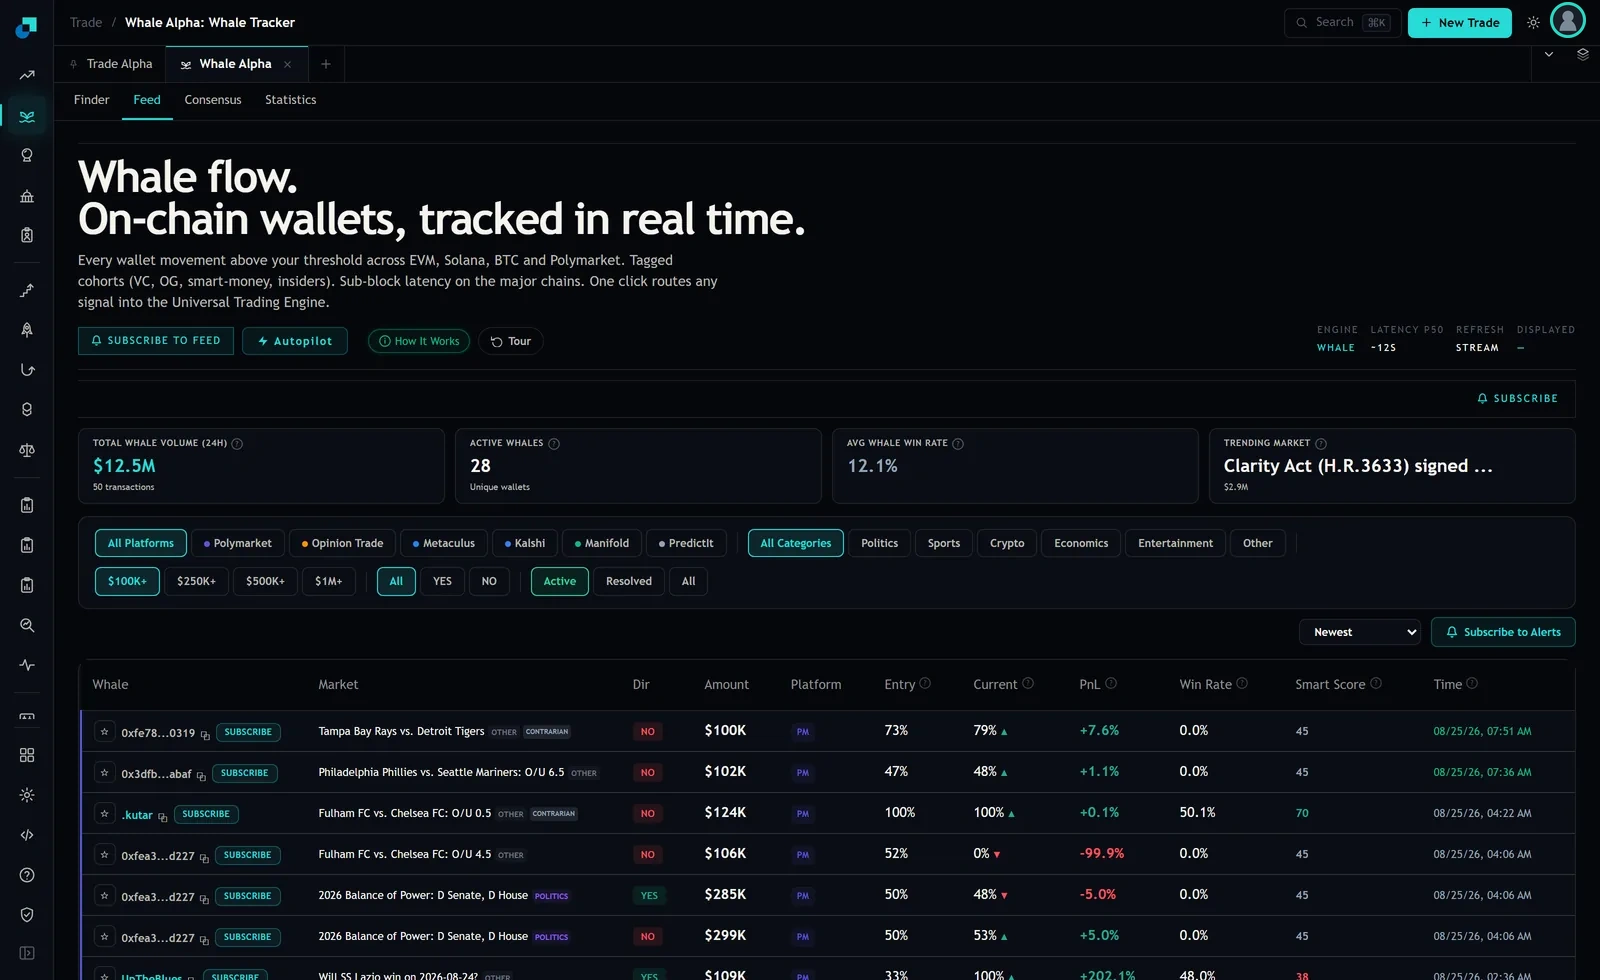
Working the rows on the screen
Take the seven positions visible at capture, all dated 25 August 2026, and run both numbers.
The Lazio row entered YES at 33 and Current reads 100, with PnL at plus 202.1 percent. Distance travelled is 67 divided by 67, which is the whole thing. There is no trade here. Buying at 100 costs you a full dollar to receive a dollar, and the only outcomes available are level or worse.
The Fulham over-under 0.5 row is the same shape without the excitement: entry at 100, Current at 100, PnL plus 0.1 percent. That position was opened at a price that already contained the answer.
The Tampa Bay row entered NO at 73 and now reads 79. Travelled is 6 divided by 27, or 22 percent. Your break-even if you follow is 79 percent. The whale is up 7.6 percent and 78 percent of the distance is still available, which makes this the only row on the screen where following is a real question rather than an obvious no.
The Phillies row at 47 into 48 is earlier still, at 1.9 percent travelled and a 48 percent break-even. And then the row that keeps the whole exercise honest: the Fulham over-under 4.5 position entered NO at 52 and Current reads 0, with PnL at minus 99.9 percent. That move also completed, at 100 percent travelled, in the direction that removes the position. Distance travelled says nothing about direction. It only says how much room is left.
The cutoff I use, and why it is not 50 percent
My rule is to skip anything above one third travelled, and to skip anything where Current is above 85 regardless of how little has moved.
The one third comes from what is left rather than from what has gone. At 33 percent travelled on a position entered at 50, Current sits around 66, so you are paying 66 to receive 100 and your break-even is two events in three. At 50 percent travelled the price is 75 and your break-even is three in four. The step from a two-in-three claim to a three-in-four claim is much larger than it looks on a screen, because the room for you to be wrong has halved.
The 85 ceiling is a separate constraint and it binds even on rows that have barely moved. Above 85 you are risking 85 to make 15, so a single loss needs roughly six wins behind it to stay level, and that is before fees and before the spread you actually pay rather than the mid the feed displays. Thin markets are exactly where the displayed price and your fill diverge most.
The lateness the columns do not show
There is a second kind of late that Entry and Current cannot see. Look at the Time column. At capture the newest row was timestamped 07:51 in the morning, the next 07:36, and then a block of three rows all at 04:06. If you open the feed once in the evening, the position you are considering is many hours old and the Current figure has already absorbed everything that happened in between.
That is worth stating plainly because the module's header advertises a median latency of about 12 seconds. The platform is fast. Your checking interval is the slow part, and the gap between the two is entirely yours. If your routine is a daily look, then the Current column is doing all the work and the Entry column is history.
The practical consequence is to sort by Newest, which is the default, and to treat anything more than a few hours old as reference rather than as an opportunity. The size filters help here too. Setting the threshold to 250 thousand or above thins the list enough that the rows you do see are recent, which is a better use of the filter than trying to find bigger signals with it.
What to do with a row that fails the test
Most rows will fail, and the useful move is not to discard them. A position that is 80 percent travelled is a finished trade, but it is also evidence about the wallet, and that evidence is free.
Note the market, the direction and the entry level, then check the same wallet's next entry. A wallet that repeatedly enters early, at levels where most of the distance is still ahead, is behaving differently from one that keeps appearing at 90 with a small profit. The Feed shows the wallet's Win Rate and a Smart Score alongside each row, and at capture those varied widely on the same screen, from 0.0 percent with a score of 45 up to 50.1 percent with a score of 70. Those columns describe the wallet. Entry against Current describes the trade. You need both, and you only get to act on the second one when it has not already happened.