The Signals tab and the Terminal tab sit next to each other in Trade Alpha, one click apart. You take a signal off the feed, you click through to the chart to place the order, and the chart opens on whatever timeframe you were last looking at. If that was 1m or 5m, you have just started managing a multi week position on a chart that redraws itself every sixty seconds, and you will almost certainly close the trade early.
This is not a discipline problem and telling yourself to be patient does not fix it. It is a resolution problem. The chart is showing you real information at a real granularity, and at that granularity a normal position looks like an emergency roughly forty times a day.
The signal row already names its own chart
The feed does not leave this to interpretation. Every row carries two columns that answer the question directly, and they sit next to each other. Timeframe, which read Mid-Term across the visible rows at capture, and Period, which read 1day on three of them and 4h on the silver row.
Period is the bar the signal was generated on. That is the chart the signal has an opinion about. Everything finer than it is detail the signal never looked at, and everything coarser is context the signal was not asking about.
So the mapping is mechanical. A row showing Period 1day belongs on the 1D chart. A row showing 4h belongs on the 4H chart. You do not need a theory about this and there is nothing to optimise.
What ten thousand bars does to your nerve
Here is the arithmetic that makes the point better than any argument about patience.
One of the open rows in the capture was a long in BK entered on 07/17 and still open on 25 August. On the 1D chart that signal was generated on, that is somewhere around twenty eight bars of life. Twenty eight candles. You can hold that entire history in your head and evaluate it in one glance.
Pull the same position up on the 1m chart and you are looking at something north of ten thousand bars for a US equity over that stretch. Every one of those bars is a fresh opportunity for the position to look wrong. The information content has not increased at all. The number of moments at which you can decide to quit has gone up by a factor of about four hundred.
That is the specific failure, and it has a specific name in the way it plays out. You do not exit because the thesis broke. You exit because you were present for a normal intraday dip at a resolution where it filled the screen. The trade then does what the daily bar was always going to do, and you watch it from outside the position.
Two charts, two jobs
The fix is not to ban the fast charts. It is to give each one exactly one job and never let them swap.
The fine timeframe has one job, which is placing the order and only placing the order. If you are entering a 1day period signal, dropping to 15m for the two minutes it takes to find the offer, see where the current session's range sits and put a limit in a sensible place is a genuinely useful thing to do. It can save you the spread and a few basis points besides. Then you close it.
The Period chart has every other job. Whether the position is working. Where the stop belongs. Whether to add. Whether the reason you entered still exists. All of those decisions are made on the chart the signal was generated on, and if you find yourself making any of them on a chart three steps finer, you are answering a question with data that was not part of the question.
A practical way to enforce this is to make the fine chart inconvenient. Place the order, then switch the Terminal back to the Period timeframe before you do anything else, including before you look at the fill confirmation. It sounds trivial. It is the single highest return habit in this whole article, because the alternative relies on you deciding to leave a chart that is actively showing you something alarming.
The Draw column is this failure measured
The feed carries a column called Draw, and on closed rows it records how far against you the position went before it resolved. It is the closest thing to a direct measurement of what the mismatched chart costs.
One of the closed rows at capture was a short in Ford entered on 08/03 at 14.43 and closed at 14.13, a realised 2.08 percent. Its Run-Up column read +3.12 percent and its Draw read -4.37 percent. So a position that finished as a winner spent time more than four percent underwater on the way there.
On the daily chart that signal lived on, that drawdown is a handful of bars going the wrong way. It is uncomfortable and it is unremarkable. On a one minute chart it is hours upon hours of continuous red, punctuated by rallies that fail, each of which reads at that resolution as a chance to get out at a better price than the one currently on the screen.
The trade was the same trade in both cases. The difference is entirely in how many times you were invited to abandon it. If your stop is set at three percent because three percent feels like a lot when you are watching it tick, that Ford short is a loser in your account and a winner in the feed, and no amount of signal quality fixes that.
The first sixty seconds after the fill
Most of the damage is done in the minutes right after the order fills, when the fine chart is still open and the position is new enough to feel provisional. A short routine covers it.
- Read the Period column off the row you just traded. Not the Timeframe column, which reads Mid-Term on a lot of things with quite different horizons. The Period column.
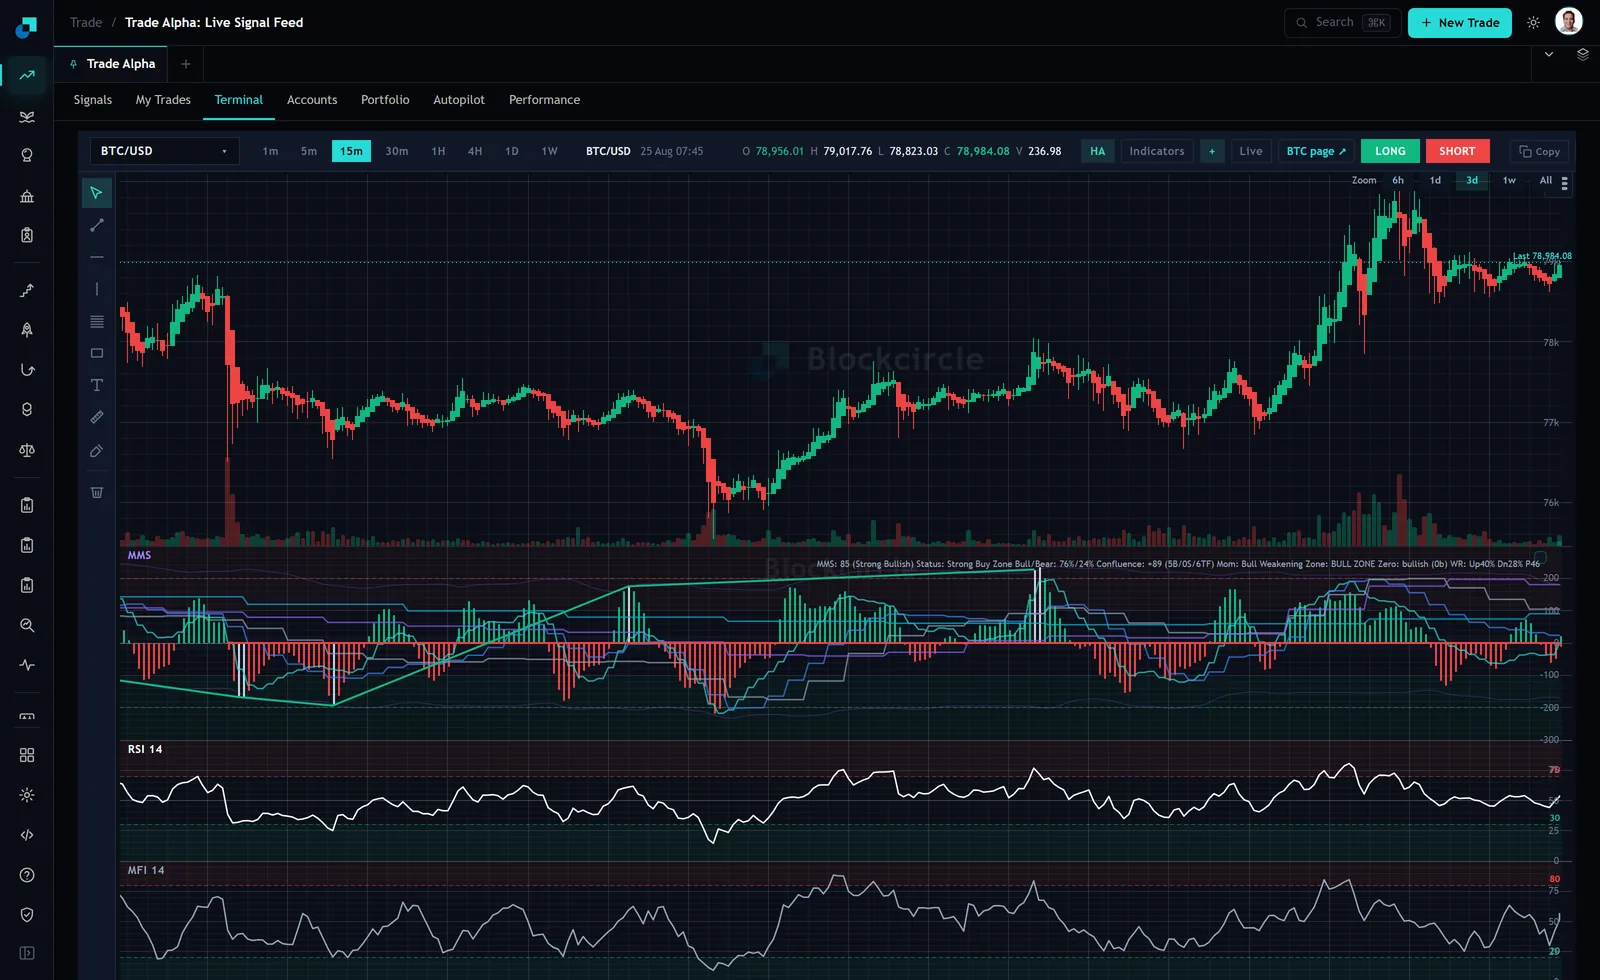
- Set the Terminal to that timeframe and set the zoom wide enough that you can see the position's whole intended life plus the context before it. On 1D that means months on screen, not the 3d preset in the capture.
- Place your stop against that chart, on the basis of the structure that is visible at that resolution. If you cannot see the level you are stopping against without zooming in, the stop is too tight for this signal.
- Decide now, while you are calm, what would actually invalidate the trade on that chart, and write it somewhere you will see it. One sentence is enough.
- Set a review interval that matches the bar. A 1day period signal is reviewed once a day, after the close, not continuously.
The last one is the part people skip, and it is the one that makes the rest hold. A position on a daily signal simply does not require your attention between closes. Checking it at eleven in the morning produces no decision you are qualified to make with the information available at eleven in the morning, and it produces plenty of decisions you are not.