Three winning trades out of three looks like skill and is not. A fair coin produces that result about one time in eight. Put fifty insiders on a leaderboard, give each of them three trades, and roughly six of them will show a perfect record for no reason other than arithmetic. The one you are looking at is very likely one of those six, and nothing about the number on the screen distinguishes them.
This is the single most expensive misreading in the insider data, because it points you at exactly the wrong names. Small samples produce extreme percentages. Extreme percentages sort to the top of any list ordered by win rate. So the top of a hit rate ranking is systematically populated by the people you know least about, and the person with a genuinely useful record of sixty percent across forty trades sits below them.
What the leaderboard shows and what it was missing
The Top Insiders table has the right columns for this. At capture they read rank, insider, titles, tickers, 30 day buy dollars, holdings dollars, top percent of float, trades, and win rate. The trades and win rate pair is exactly what you need, since a rate without a count is not interpretable.
Two things were true about that screen on the day I read it, and both are worth knowing before you go looking. The table was sorted by 30 day buy dollars, not by win rate, so the default ranking rewards size rather than accuracy. And the win rate column contained no values on any visible row, along with the holdings and float columns beside it. So the scenario in the title of this piece was not something I could produce from the live screen. I am describing the trap you will walk into when those cells fill in, and the reading habit that stops it, not a number I saw.
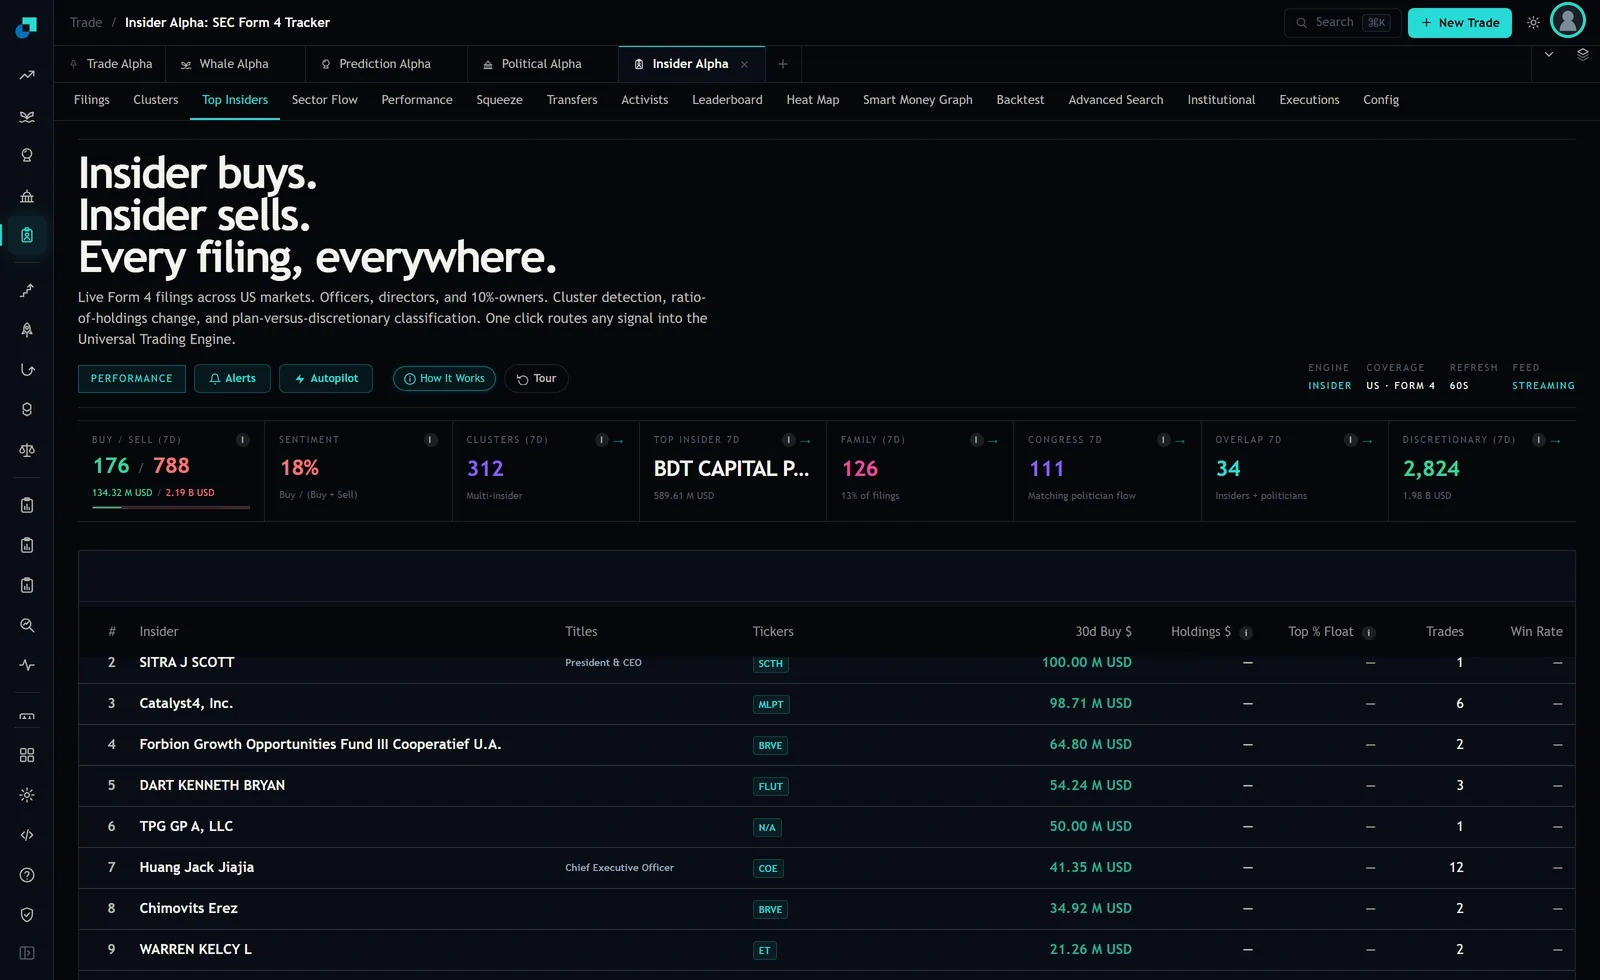
Twelve trades was the largest count visible. Several rows showed one. A single trade cannot have a meaningful win rate, and yet a single winning trade renders as one hundred percent, which will sort above a filer with a long and genuinely good record. That is not a flaw in the table, it is what percentages do to small denominators, and the defence is entirely on your side of the screen.
The numbers that make a rate readable
You do not need statistics to use this, you need four reference points. Take a filer who wins half the time by luck alone, and ask how often a perfect record appears.
| Trades | Chance of a perfect record from luck alone | What it is worth |
|---|---|---|
| 3 | About 1 in 8 | Nothing at all |
| 5 | About 1 in 32 | Nothing on a list of fifty filers |
| 10 | About 1 in 1,000 | Interesting, still not conclusive |
| 20 | About 1 in a million | Worth an hour of your time |
Note the middle column is the chance for one filer. On a leaderboard you are not looking at one filer, you are looking at whichever one came top out of hundreds, which is a different and much weaker claim. This is why the five trade row says nothing on a list of fifty. Something with a one in thirty two chance per person will happen to somebody in a group that size almost every time.
The practical rule I use is a floor of twenty completed trades before a hit rate enters the decision at all, and even then I want to see the losses. A record of thirteen wins and seven losses is more trustworthy than nine wins and no losses, because the first one has been tested and the second has not been.
The rough interval you can do in your head
There is a shortcut worth learning, because it converts a hit rate into the range it actually represents. Take the rate, then add and subtract roughly one divided by the square root of the number of trades. That gives you a band that is close enough for this purpose.
Sixty percent on nine trades gives one over three, which is thirty three points either side. The true rate is somewhere between about twenty seven and ninety three percent. That range includes worse than a coin flip, so the number has told you nothing. Sixty percent on a hundred trades gives one over ten, so ten points either side, and the range runs from fifty to seventy. Now the number is doing work, and even then the bottom of the range is break even.
Run that on any hit rate before you act on it. Most of them collapse. The ones that survive are attached to filers with long, dull, repetitive records, which is the same conclusion the arithmetic in the previous section reaches by a different route.
Why the sample is smaller than the trade count suggests
There is a further discount to apply, and it catches people who have already learned the sample size lesson. Twenty trades by one insider in one company across one year are not twenty independent observations. They are close to one observation about one company in one market environment, repeated twenty times. If the stock went up because the sector went up, every trade in that record is a winner for a reason that has nothing to do with the person who filed.
So look for spread before you count. Trades in more than one company, across more than one year, including at least one period when the market was falling. A record built entirely in a rising market is untested, and the twelve trade row on the leaderboard is worth more if those twelve are spread across time than if they are twelve fills of one position in one week.
The module's own aggregate view is a useful piece of grounding here. At capture its forward return attribution panel reported 20,000 scored filings at the seven day horizon, with an average return of plus 0.25 percent against plus 0.07 percent for SPY, and a win rate of 46 percent. That is the whole filing population, and it wins less than half the time over that window. Any individual claiming a rate far above it needs a sample large enough to justify the gap, and the further above it they sit, the more trades you should demand before believing it.
What to do with a leaderboard instead
Stop using it as a ranking and start using it as a filter. Ranking asks who is best, which small samples answer badly. Filtering asks who has enough history to be worth examining, which small samples answer perfectly well, since a trade count of two is unambiguous.
The workflow that survives contact with reality is short. Set a minimum trade count and ignore everything below it, whatever percentage is attached. Sort what remains by trade count rather than by rate. Take the two or three filers at the top of that list and check their records yourself against the filings, which are public. Then decide, based on what those records are made of, whether you want to follow any of them at all.
You will end up with fewer candidates and a much better reason for each one. That trade is worth making, because the cost of the other approach is not an abstract statistical error. It is real money in a real position, sized on the strength of a number that a coin could have produced.