An implied volatility of 38.5 percent is a level, and a level on its own is not information. It does not tell you whether options on that name are expensive or cheap, because expensive and cheap are relative words and you have given the sentence nothing to be relative to. A biotech at 38.5 percent is unusually calm. A utility at 38.5 percent is on fire. The number only starts working once you put it somewhere in the asset's own history.
There are two standard ways to do that, they are computed differently, and they routinely disagree. Most people pick whichever one their platform shows and never notice that the other one is telling a different story. The disagreement is not a nuisance. It is usually the most useful thing on the screen.
Two formulas, and what each one is actually measuring
IV Rank asks where today sits between the lowest and highest readings of the past year. Take the current implied volatility, subtract the 52-week low, divide by the 52-week range, multiply by 100. It is a position between two points.
IV Percentile asks something different: on what fraction of the last 252 trading days was implied volatility lower than it is today. It is a position within the whole distribution, and every day in the window gets one vote.
Work an example. Say the current reading is 38.5 percent, the 52-week low was 22 and the high was 95. Rank is 38.5 minus 22, over 95 minus 22, which is 16.5 over 73, or about 23. That looks cheap. Now suppose that 95 came from a single violent week and the asset spent most of the year oscillating between 30 and 45. In that case implied volatility was below 38.5 on more than half the days in the window, so the percentile comes in somewhere around 55. Rank says today is near the bottom of the range. Percentile says today is slightly above typical.
Both numbers in that example are correct. They answer different questions. Rank is answering how far today is from the extremes. Percentile is answering how unusual today is compared to an ordinary day.
Rank breaks after a crash, percentile does not
Once you see that rank depends entirely on two observations, its weakness is obvious. A single spike sets the high for the next twelve months, and every reading in between gets divided by an inflated range. The result is that in the year following any violent episode, rank reads persistently low, and it reads low for exactly as long as the spike remains in the window. Then, on the day the spike rolls off the back of the 52-week lookback, rank jumps sharply without implied volatility having moved at all.
Percentile does not have that problem, because one outlier is one vote out of 252. It has a different one: it is insensitive to magnitude. If implied volatility has drifted between 30 and 32 all year and today prints 32.5, percentile will say 98 while any sensible person looking at the chain would say nothing much is happening.
The practical rules I use are short. In a quiet tape with no recent spike in the window, the two agree and it does not matter which you read. In the twelve months after a crash, trust percentile and treat rank as broken. When the two disagree by more than about 25 points, stop and look at the actual history, because the disagreement means the distribution has a shape that neither single number is capturing. And on an instrument with less than a year of clean history, neither measure means anything, so do not compute one to make yourself feel informed.
The readings that should stop a seller from opening anything
The whole point of these measures for a retail trader is deciding whether to sell premium. Here is the short list of readings on which I do not sell, regardless of how good the setup looks otherwise.
- Rank and percentile both low. If premium is cheap by both measures, you are being paid at the bottom of the range to take on a risk whose price can multiply. This is the worst risk-reward in options and it is where impatient sellers live.
- Implied volatility falling fast while rank is still high. A high rank taken mid-collapse means you are selling into a price that is already running away from you, and the credit on the ticket is smaller by the time you fill than it was when you decided.
- A scheduled event inside the option's life. High rank in front of a known catalyst is not mispricing, it is the catalyst. Selling it is a bet on the outcome, and you should only make that bet if you have actually formed a view on the outcome.
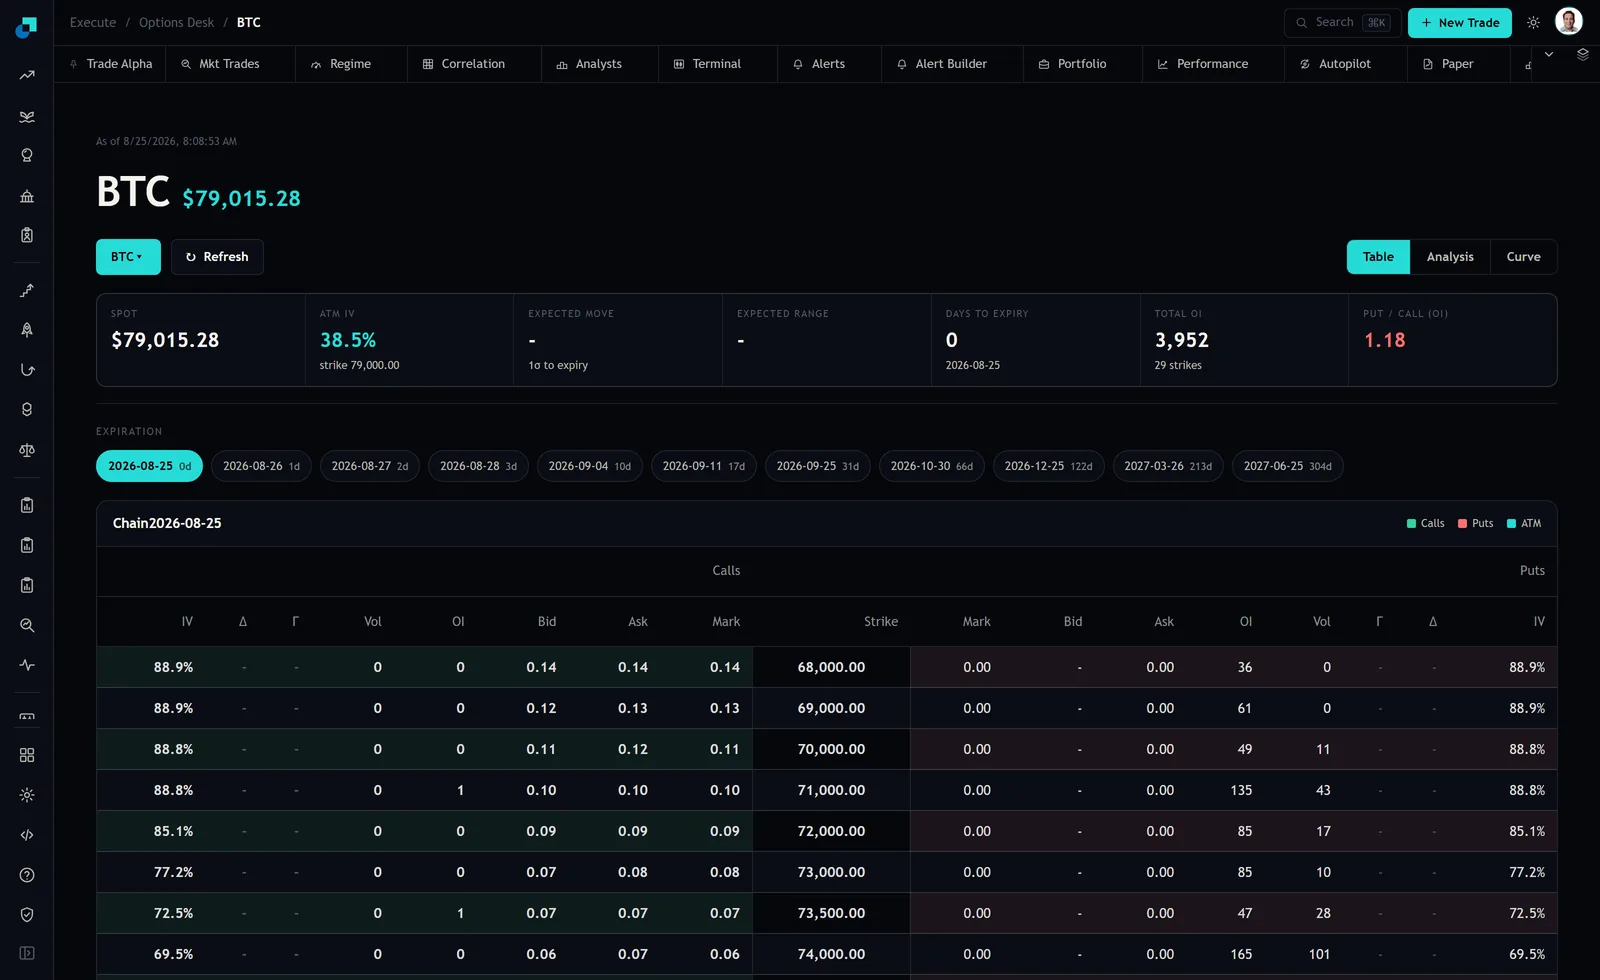
- A chain with almost nothing in it. On the BTC chain I looked at on 25 August 2026, total open interest on the front expiry was 3,952 contracts across 29 strikes, roughly 136 per strike on the busiest expiry on the board. When per-strike interest is thin, the spread you cross twice can be larger than the edge the rank was pointing at.
A high rank is not a prediction that volatility falls
This is the part that costs people real money, so it is worth being blunt about. A high IV rank says premium is expensive relative to the last year. It does not say premium will get cheaper. Implied volatility at the 90th percentile can go to the 99th, and the environments where it does are precisely the environments where the underlying is moving violently against somebody.
What that means in position terms is specific. If you sell a naked call, the loss has no ceiling, because there is no ceiling on the underlying. If you sell a naked put, you are obliged to buy at the strike no matter how far the price has fallen, so the loss runs all the way down and can be many multiples of the premium you collected. On a 79,000 strike that is an obligation measured in tens of thousands against a credit measured in hundreds. Defined-risk versions, where you buy a further strike to cap the tail, cost you part of the credit and are the only version of this that belongs in a small account.
There is also a subtler failure. High rank clusters. It is high because volatility is elevated, volatility is elevated because something is going on, and the something is often not finished. Selling the first high-rank reading of a crisis is the single most reliable way this indicator gets people hurt, and it happens because the number looked better the deeper the trouble got.
Building the history yourself, starting this week
Neither measure exists without a year of readings, so if you do not have that history, collect it. This is a five-minute-a-day habit and it is the only way the measure becomes yours rather than a black box.
Open the Options Desk on the names you actually trade, read the at-the-money implied volatility for the front monthly expiry, and log it in a spreadsheet with the date and the as-of timestamp the page shows. One row a day. After about 60 sessions you have enough for a rough percentile, which is genuinely usable. After a year you have both measures on your own data, computed on a consistent expiry, which is more than most retail traders reading a rank number off a screen can say, because they usually do not know which expiry was used to build it.
Keep the raw level in the sheet next to the derived numbers. When rank and percentile disagree, the level and the shape of the history are what you go back to, and if you only stored the summary statistics you will have thrown away the thing that resolves the argument.