Momentum's return distribution is unremarkable for long stretches and then produces a loss that no risk report saw coming. The reason the loss is invisible in advance is that it is a property of the portfolio rather than of any position in it. Every name looks fine. The book does not.
The mechanism is well established and worth restating precisely, because the version most people carry is a slogan about crowded trades rather than a description of what actually happens to the exposures. And the version that applies to a per-instrument trend engine is related to but not identical with the classic one, which matters a great deal for what you should instrument.
The mechanism, stated as exposure arithmetic
Take a cross-sectional momentum book, long recent winners and short recent losers. Now run it through a deep and extended market decline.
The losers portfolio fills up with the names that fell hardest, which is to say the high-beta, heavily de-rated, balance-sheet-stressed end of the market. The winners portfolio fills up with whatever held its value, which is the defensive end. The book has not changed its rules and nobody has made a decision, but it is now short high beta and long low beta, and its net market exposure has gone materially negative.
Then the market turns. The long-running result in the momentum literature is that the strategy's worst losses cluster immediately after market bottoms and coincide with high market volatility, and this is the arithmetic behind it. On a sharp rebound the short leg rises faster than the long leg because it has more beta, so the spread loses on both sides at once. The loss is large because it is levered by construction and because the leg that moves most is the one you are short.
The important structural feature is that the flip requires no error. It is produced by the selection rule operating correctly on a market that has been falling for long enough. Nothing in a position-level risk report will flag it, because no position is unusual.
What a per-instrument trend engine inherits and what it does not
This matters because the Momentum Trading Engine, as its signal feed presents it, is not a cross-sectional long-short book. The stock feed publishes per-configuration cards, each attached to one instrument.
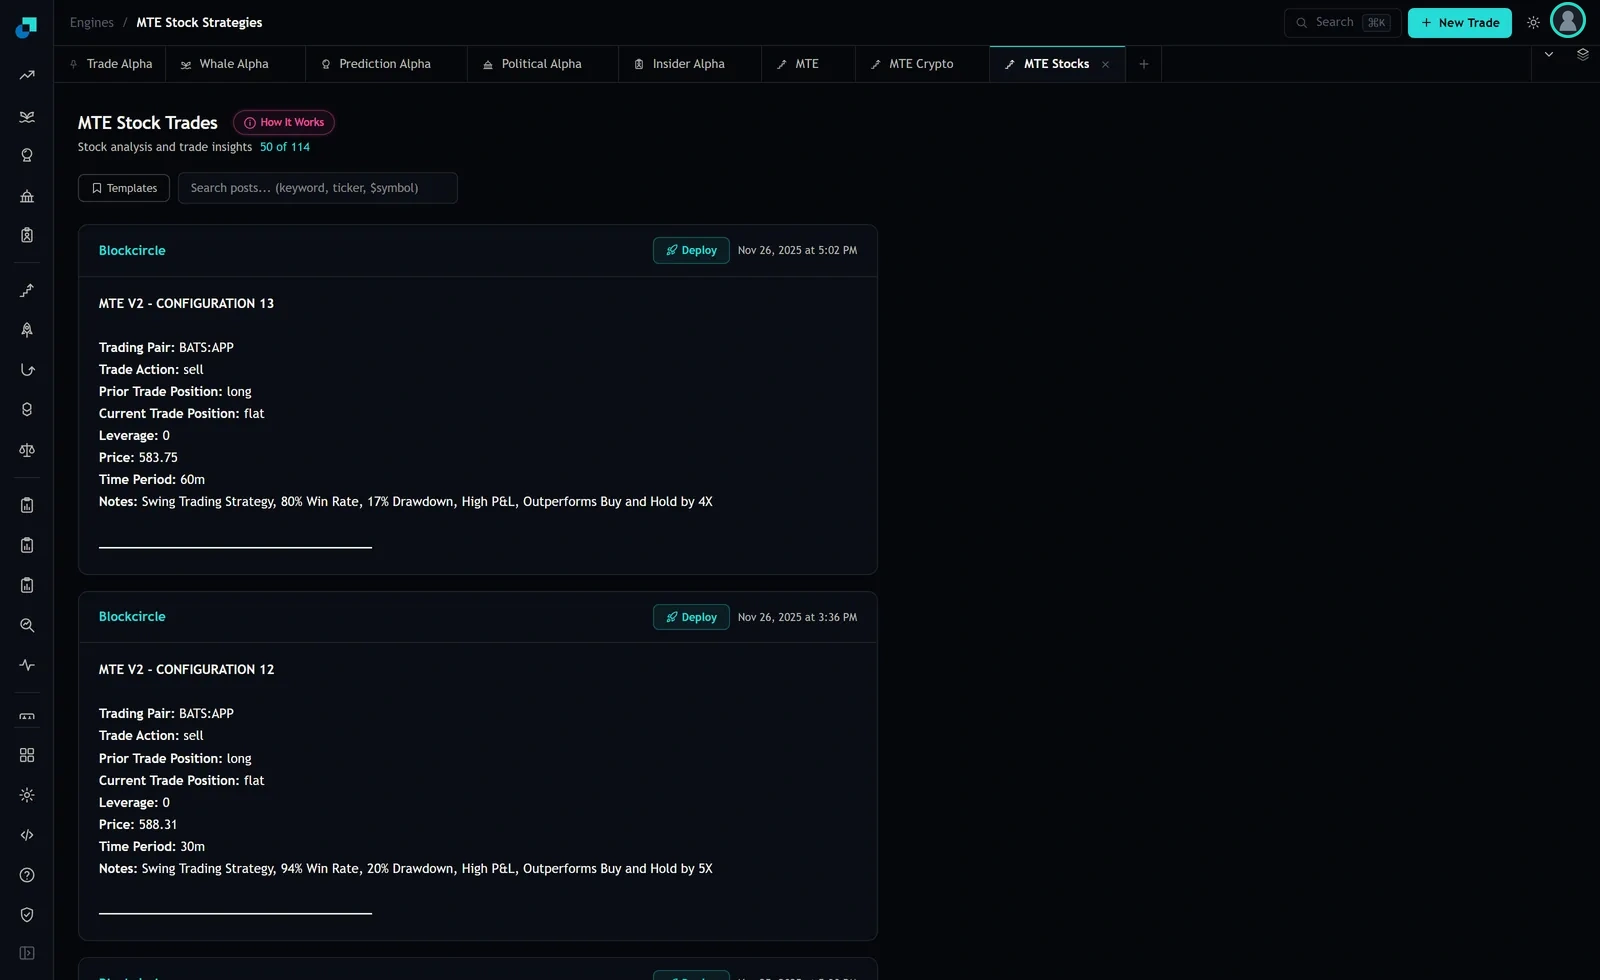
Read the state fields on those cards. At capture, CONFIGURATION 13 on BATS:APP carried Trade Action sell, Prior Trade Position long, Current Trade Position flat, on a Time Period of 60m. Immediately below, CONFIGURATION 12 on the same instrument carried the same transition on a Time Period of 30m. The transition is long to flat, not long to short.
A book of instrument-level trend systems that exit to flat does not carry a systematic short leg, so the beta inversion described above is not automatic. What it carries instead is a common exit. After a broad decline, every long system in the book goes flat at roughly the same time, and the rebound then happens with the book on the sidelines. The loss registers as a missed recovery rather than as a short squeeze.
Both are momentum crash losses in the sense that matters, which is that they arrive together and they arrive after a bottom. They have different signatures and different remedies, and confusing them leads to hedging the wrong thing. Note also the two configurations on one instrument: 60m and 30m on BATS:APP is two deployments, one name, and exits that resolve within an hour of each other.
The fields that would not have warned you
Go through what the card actually contains: Trading Pair, Trade Action, Prior Trade Position, Current Trade Position, Leverage, Price, Time Period and Notes. There is no beta, no sector, no net exposure, no correlation and no measure of how many other configurations did the same thing this session.
The Notes field is the one that will actively mislead here, because it is the one people quote. CONFIGURATION 13's note read: swing trading strategy, 80% win rate, 17% drawdown, high P and L, outperforms buy and hold by 4X. CONFIGURATION 12's read 94% win rate, 20% drawdown, outperforms buy and hold by 5X. Those are static labels attached to the configuration and carried on every card it emits. They describe a backtest, not the current state of anything.
Win rate in particular is the statistic least sensitive to the risk under discussion. A strategy can win 94 percent of its trades and lose everything it made in the other six percent, and the crash loss lands exactly in that six percent. A high win rate and a large left tail are not in tension; on trend systems they are frequently the same fact seen from two sides. The stated drawdown figures of 17 and 20 percent are backtest maxima over samples the card does not size, which means they are a lower bound on what is possible rather than an estimate of it.
The fields that would have said something
Three, and all three require reading the feed in aggregate rather than card by card.
The position transition fields are an exposure tape if you read them across the whole feed for one session. If most cards in a day read long to flat, your book just went to cash together, and that is the leading indicator of the missed-recovery version of the loss. The engine gives you the raw material for this; the aggregation is yours to build.
The Leverage field converts a missed recovery into something worse. On the stock cards it read 0. On the crypto side of the same engine a configuration on a perpetual carried Leverage 2. Leverage multiplied by a simultaneous exit across correlated names is how a drawdown becomes a financing problem rather than a performance problem.
Time Period tells you how tightly the exits will cluster. Two configurations on one name at 30m and 60m will resolve within an hour of each other. Configurations at 1day resolve at the same bar boundary as every other daily strategy in the book.
What to instrument before the next one
Four things, none of which the engine can produce for you and all of which are cheap if built before they are needed.
- Daily net beta of the sleeve, computed from your own position file against your own factor estimates, stored as a time series. This is the single number that makes the classic version of the crash visible in advance, and it does not exist anywhere in the product.
- Proportion of the book sitting flat, sampled daily. A rule tied to that state rather than to a forecast: when the flat proportion crosses a threshold within a small number of sessions, that is a re-entry risk event and the response is decided in advance.
- Instrument-level deployment count. If two configurations run the same name on adjacent timeframes, the sleeve's true position in that name is the sum, and the exits are not independent.
- A pre-agreed response to the re-entry problem, chosen now: either a staged re-entry schedule, or an index hedge carried until the systems re-engage. Both are defensible and both are much harder to authorise in the week the market is rebounding without you.
The one thing not to do is let a win-rate label into the risk model. Whatever 94 percent describes, it is not a statement about the size of the six percent, and the six percent is the entire subject of this article.